In the last regression post we added more variables, but not all of them, I was holding back and not telling you why. So far we have been dealing with quantitative variables which ask how many or how much, the next is qualitative or categorical. Categorical usually asks which, and while it may be a number it would not make sense to perform math against it.
Monthly Archives: December 2017
Linear Regression the Formula 202
Published December 26, 2017 / by shep2010One item that might me a tiny bit helpful is to realize that as many moving parts as there are in regression it all boils down to a pretty simple formula for calculating a prediction. More of this will be covered piece by piece in the coming posts, but i wanted one post that will go through the formulas up to now.
Multiple Linear Regression Level 201
Published December 24, 2017 / by shep2010 / 1 Comment on Multiple Linear Regression Level 201The next few posts is just adding some more explanatory variables to see if we can get a better model from predicting mpg. We are going to keep it simple today and focus on just quantitative variables not categorical(qualitative), if that does not make any sense to you it will soon.
In the REAL world you would never predict a vehicle mpg by weight alone, there are dozens if not hundred of other variables to consider. Lucky for us the mtcars dataset only has 11 variables to consider. The grand finale of this linear regression will be a real dataset we can play with from the EPA with thousands of rows and dozens of columns. 😀
Lets get to it!
Continue reading
Linear Regression Level 104 – Prediction
Published December 23, 2017 / by shep2010 / 1 Comment on Linear Regression Level 104 – PredictionLets try and bring simple linear regression together before i move on to multiple. We started with a question, can we predict miles per gallon using weight of a vehicle? We looked at a scatter plot and saw a bit of linearity. We created a model and looked at the residuals and determined they are for he most part demonstrating constant variance and we looked at a histogram of the residuals and it is demonstrating enough normal distribution to move forward. I know, i’m not sounding very convincing am i? Its a small dataset and its for learning, having some values that are out in left and right field but are actually useful so i can demonstrate some other points later in this post.
Continue reading
Linear Regression 103 p-value
Published December 22, 2017 / by shep2010We need to talk about p-value. The calculation for p-value is a hot nightmare, not going to bother with it right now, if you need to know more about it you can find online calculators, but rarely an actual formula. Even the sites that will spill the beans on all the other formulas will resort to a t distribution calculator for p-value. Though i may fall back in a future post and spend some time on t-distribution, we shall see.
Continue reading
Linear Regression – Level 102, all the Numbers
Published December 21, 2017 / by shep2010My last linear regression post i mentioned that most of the numbers come form the residual errors, thats not entirely true. You have a basic understanding of lm you learned that R-square is the number to look at, that is based on residual error. You are also told to examine the p-value for each coefficient and for the entire model. P-value is a little bit harder to calculate, go search and find out for yourself. But in lieu of that i am going to provide the actual calculation for everything you may have seen reference in an lm.
Continue reading
Linear Regression Level 101
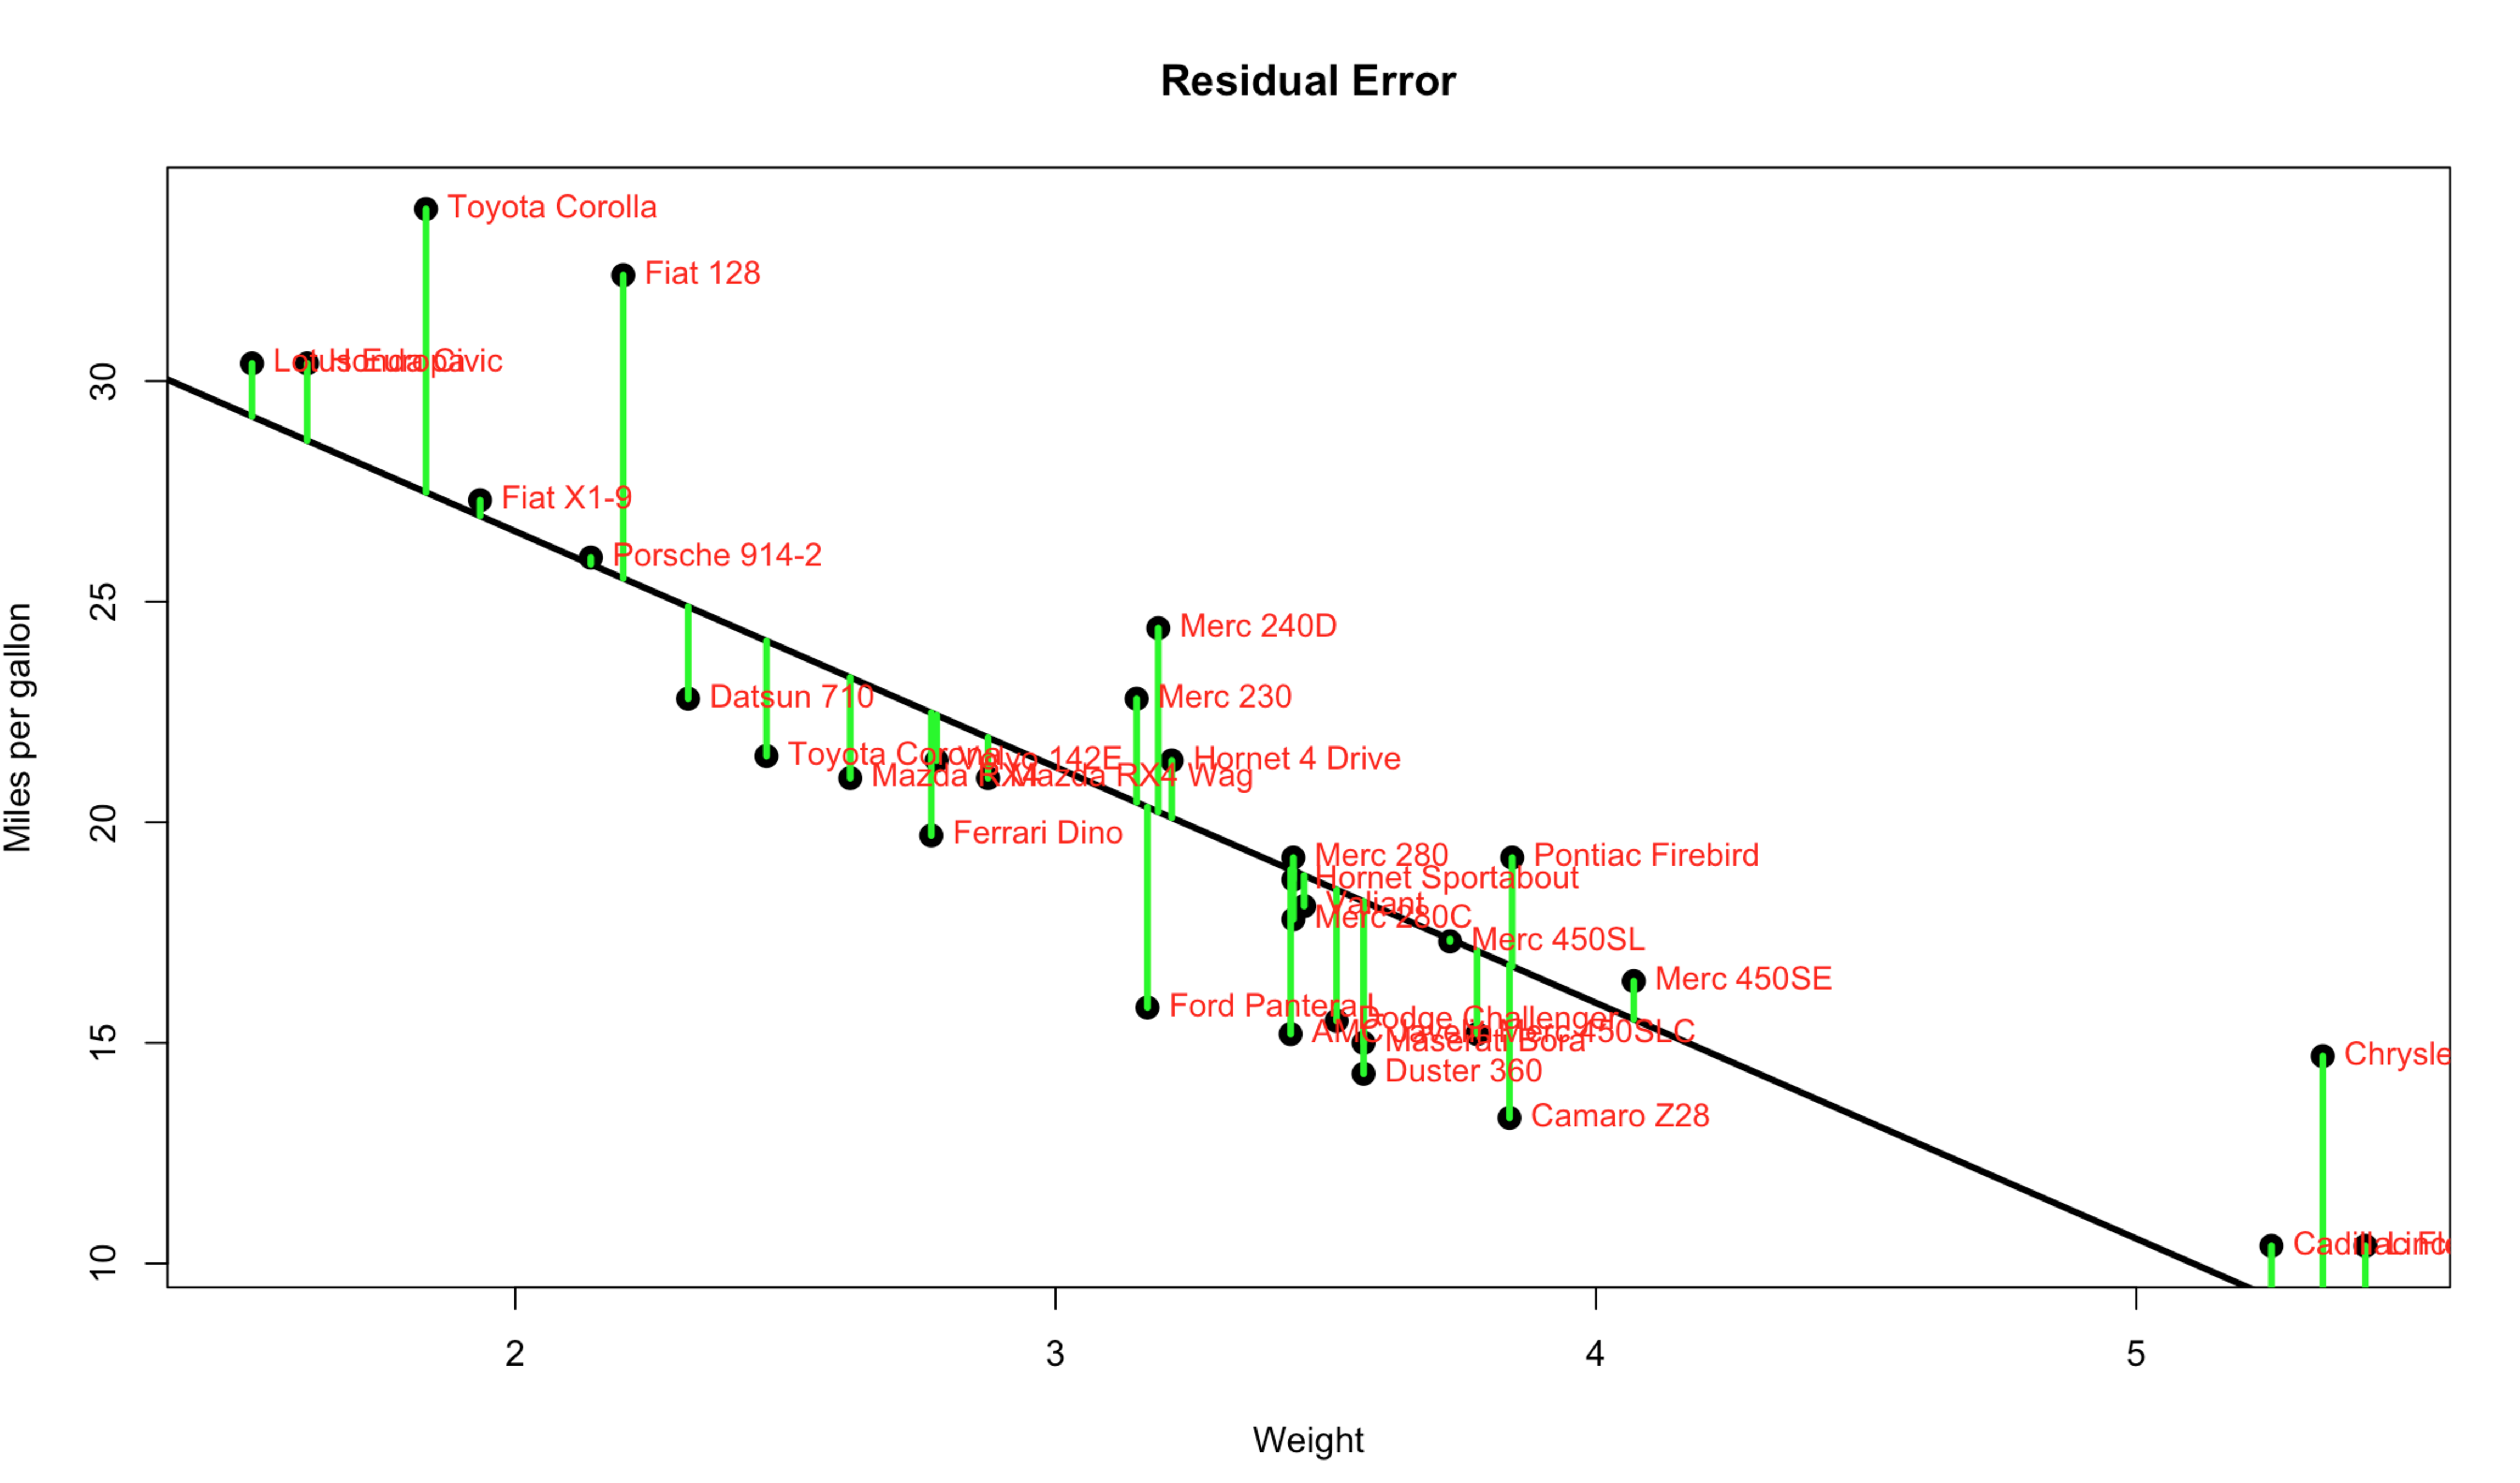
Published December 20, 2017 / by shep2010All the numbers, so many numbers, do we really need all of them…? If you want to make a an informed decision yes, you do. On the bright side they are not very hard to interpret, almost all of the numbers are related to just one number… The Error, more specifically the Residual Error. I’m going to blow your hair back again, its not an error, its nothing like and error, it should have never been called an error, its a difference. It is the difference between the line we ran through the middle of the scatter plot and the data points. Each point has a difference between the line and where the dot falls. Take a look at the visual below, the green line represents the distance between the line and the actual data point, thats our residual error. Its not hard to see that the larger the distance between the line and the data points the worse our model will perform. Not to mention the closer the data is to the the better.
Linear Regression Level 100
Published December 19, 2017 / by shep2010I think it’s difficult for a professor or teacher to know at exactly what point should linear regression be taught in a curriculum, it seems like it turns up everywhere calculus, algebra stats, modeling. It should be in all of them, but then the next question is do you need to know algebra, matrix algebra and linear algebra before knowing how to do a linear regression? I don’t know to be honest. Having worked with SQL for most of my adult life I have had to know and use all three and did not pay much attention to it or realize until I started formally beefing up my academics.
Regardless, the one thing I have heard from a few stats instructors is “don’t worry about how its done or how it works, the software will take care of it for you”, to be fair, these were not stats professors at the local beauty college, these were ivy league educated (I checked) professors and teachers saying this. Which, my problem is if I don’t know how it works I will probably not truly understand it, ever. Depending on what you are doing a trivial knowledge may be sufficient, but what if it’s not? If I am in an interview can I use the words “the software will do it for me” as the answer to a hard question?
What?
In the next few posts, I will do my best to define Linear Regression in R using lm. Continue reading
Level What?
Published December 18, 2017 / by shep2010Level 100,200,300…, eh? WTF is that? Level xxx is a term we used at Microsoft to set expectations of the audience and the speaker. As a speaker i need to know what my audience is, and as an audience you probably do not want to attend a level 400 Neural Net if you are not prepared for it. As a rule, only the top engineers and developers delivered level 400 content. I never have, i doubt i ever will, i am not interested enough in anything to stick with it to level 400.
Continue reading
Visualizing SQL Server Agent History with R and ggplot
Published December 15, 2017 / by shep2010Hopefully, when you are done running through this you will have something like this. All jobs that have been running longer than x minutes over a 24 hour period and what jobs they overlap, which is not trivial if you are looking at management studio output. You can also use the facet_wrap that you were introduced to in the last blog to look at one job over weeks and months.

R Script for this is here on github, grab it and walk along with the blog.