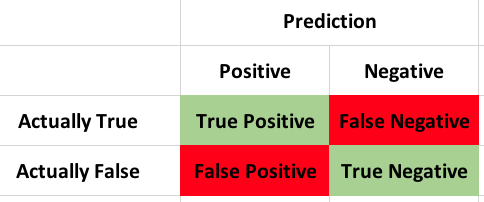
If the title of the thing you are using is called confusion, stop and start over. Never will you need more proof that statistics is deliberately screwing with you and trying to keep you away until you disassemble a confusion matrix. In lieu of the name, lets give it some new names;
Bewilderment matrix, disorientation matrix, agitation matrix, befuddling matrix, perplexity matrix, i think you get the point…
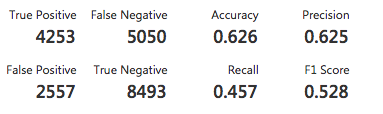
So what it is it? From an Azure ML classification i am working on, lets take a look at just a tiny bit of it.
Before i can move to the next post i need to cover some tough problems for statistics and more specifically, regression.
All of the work we do in statistical learning is based on the fact we can predict y based on x. If i eat 10,000(x) calories a day i will be fat(y) unless i am an Olympic swimmer apparently, so it does not always hold true, but with just one dependent and one independent variable, it would appear to be an easy answer. Now if i added physical activity to the mix, fat or not fat might be more accurate. Every now and then you will hear about a “study” that some new claim is made from, and the world falls apart for a few days talking about nothing else. My most recent favorite post is diet soda makes you fat, gives you cardiovascular disease, hypertension, metabolic syndrome and type II diabetes. Whether you believe that or not, and for the sake of argument the article does not mention level of activity per day, calories of food consumed per day, you know, lots of other stuff that could contribute. The study appears to make the claim that diet soda all by itself will cause all of these health problems. Peter Attia has started to write about the problems with these studies and the problems with them. Continue reading →
Yeah, levels were cute at Christmas i’m over it, lets do some prediction.
This whole series of posts started because the regression and data from the mtcars test data provided was useless as predicting the mpg of my truck, looking at the dataset it is not hard to figure the dataset is useless for any modern vehicle, to be fair it was not meant to be. Continue reading →
You were warned! If you have ever sat in on a single data science talk you probably learned that the data engineering phase of a project will take 80% of your time. This is an anecdotal number, but my experience to date seems to reenforce this number. On average it will take about 80% of whatever time you have to perform the data engineering tasks. This blog is going to likely prove that, though you will not have had to do the actual work, just copy and paste the code and run it. You will however get an idea of the pain in the ass you are in for.
I am going to approach this post and the scripts exactly the way i came to the dataset, so i will remove rows, then learn something new and remove some more rows or maybe add them back. I could simply put the data engineering at the top, and not explain anything but that is not how the world will work. The second, third, forth, one hundredth time you do this you will have the scripts and knowledge. With any new dataset, curiosity and exploration will make the process of modeling much easier.
More variables! For this one we are going to add all of the variables in their correct form in the data frame as qualitative or quantitative.
If you starting with this post, lets get the data loaded up, fix the column names, convert factors to a type of factor, and create a column for out non imperial friends so they can understand the mpg thing. Continue reading →
In the last regression post we added more variables, but not all of them, I was holding back and not telling you why. So far we have been dealing with quantitative variables which ask how many or how much, the next is qualitative or categorical. Categorical usually asks which, and while it may be a number it would not make sense to perform math against it.
One item that might me a tiny bit helpful is to realize that as many moving parts as there are in regression it all boils down to a pretty simple formula for calculating a prediction. More of this will be covered piece by piece in the coming posts, but i wanted one post that will go through the formulas up to now.
The next few posts is just adding some more explanatory variables to see if we can get a better model from predicting mpg. We are going to keep it simple today and focus on just quantitative variables not categorical(qualitative), if that does not make any sense to you it will soon.
In the REAL world you would never predict a vehicle mpg by weight alone, there are dozens if not hundred of other variables to consider. Lucky for us the mtcars dataset only has 11 variables to consider. The grand finale of this linear regression will be a real dataset we can play with from the EPA with thousands of rows and dozens of columns. 😀
Lets try and bring simple linear regression together before i move on to multiple. We started with a question, can we predict miles per gallon using weight of a vehicle? We looked at a scatter plot and saw a bit of linearity. We created a model and looked at the residuals and determined they are for he most part demonstrating constant variance and we looked at a histogram of the residuals and it is demonstrating enough normal distribution to move forward. I know, i’m not sounding very convincing am i? Its a small dataset and its for learning, having some values that are out in left and right field but are actually useful so i can demonstrate some other points later in this post. Continue reading →