In Logistic Regression 3 we created a model, quite blindly i might add. What do i mean by that? I spent a lot of time getting the single data file ready and had thrown out about 50 variables that you never had to worry about. If you are feeling froggy you can go to the census and every government website to create your own file with 100+ variables. But, sometimes its more fun to tale your data and slam it into a model and see what happens.
What still needs done is to look for colliniearity in the data, in the last post i removed the RUC variables form the model since the will change exactly with the population, the only thing they may add value to is if i wanted to use a factor for population vs. the actual value.
If you are more interested in Python i have created a notebook using the same dataset but with the python solution here.
Woo Hoo here we go, in this post we will predict a president, sort of, we are going to do it knowing who the winner is so technically we are cheating. But, the main point is to demonstrate the model not the data. The ISLR has an great section on Logistic Regression, though i thing the data chose was terrible. I would advise walking through it then finding a dataset that has a 0 or 1 outcome. Stock market data for models sucks, i really hate using it and really try to avoid it.
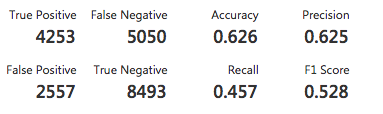
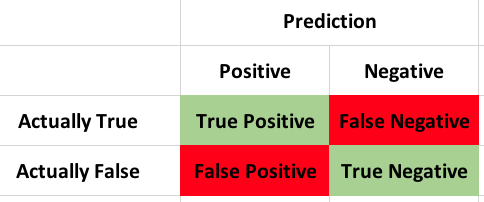
If the title of the thing you are using is called confusion, stop and start over. Never will you need more proof that statistics is deliberately screwing with you and trying to keep you away until you disassemble a confusion matrix. In lieu of the name, lets give it some new names;
Bewilderment matrix, disorientation matrix, agitation matrix, befuddling matrix, perplexity matrix, i think you get the point…
So what it is it? From an Azure ML classification i am working on, lets take a look at just a tiny bit of it.
Before i can move to the next post i need to cover some tough problems for statistics and more specifically, regression.
All of the work we do in statistical learning is based on the fact we can predict y based on x. If i eat 10,000(x) calories a day i will be fat(y) unless i am an Olympic swimmer apparently, so it does not always hold true, but with just one dependent and one independent variable, it would appear to be an easy answer. Now if i added physical activity to the mix, fat or not fat might be more accurate. Every now and then you will hear about a “study” that some new claim is made from, and the world falls apart for a few days talking about nothing else. My most recent favorite post is diet soda makes you fat, gives you cardiovascular disease, hypertension, metabolic syndrome and type II diabetes. Whether you believe that or not, and for the sake of argument the article does not mention level of activity per day, calories of food consumed per day, you know, lots of other stuff that could contribute. The study appears to make the claim that diet soda all by itself will cause all of these health problems. Peter Attia has started to write about the problems with these studies and the problems with them. Continue reading →
I learned logistic regression using SPSS, which if you have no plans to use SPSS in life its sort of a waste of time. My professor said “i don’t know how to do that in SPSS” a lot, professor also said look it up on google a lot too. I expected better from Harvard Extension, but after i found out how easy it is to teach a class there i suddenly wasn’t surprised. Point being, do as much research on instructors and professors before had as you possibly can, if there is no public data or this is the their first or second year teaching, maybe pass for something else. The class assembled and demanded a refund from Harvard btw, Harvard is a for profit private school, they did not amass a 37 billion dollar endowment by issuing refunds, so, buyer beware, and we did not get our money back. Continue reading →
Yeah, levels were cute at Christmas i’m over it, lets do some prediction.
This whole series of posts started because the regression and data from the mtcars test data provided was useless as predicting the mpg of my truck, looking at the dataset it is not hard to figure the dataset is useless for any modern vehicle, to be fair it was not meant to be. Continue reading →
You were warned! If you have ever sat in on a single data science talk you probably learned that the data engineering phase of a project will take 80% of your time. This is an anecdotal number, but my experience to date seems to reenforce this number. On average it will take about 80% of whatever time you have to perform the data engineering tasks. This blog is going to likely prove that, though you will not have had to do the actual work, just copy and paste the code and run it. You will however get an idea of the pain in the ass you are in for.
I am going to approach this post and the scripts exactly the way i came to the dataset, so i will remove rows, then learn something new and remove some more rows or maybe add them back. I could simply put the data engineering at the top, and not explain anything but that is not how the world will work. The second, third, forth, one hundredth time you do this you will have the scripts and knowledge. With any new dataset, curiosity and exploration will make the process of modeling much easier.
Its fun when you find something new, and in R that can happen a LOT. MS SQL was frustrating in the fact that back in the day you would wait years for a single feature to come out then another decade for MS to get their shit together and finish the feature. Column store was a great example of taking years to get a feature released incrementally over several versions. Keep in mind CCI(Column Store) is my absolute favorite thing ever done in SQL, and it happens to be in Hadoop as well as ORC and Vectorization, same guy pm’d and wrote both in case you are interested. Open source does not suffer from this so you can frequently get new features added or entirely new packages that solve problems and give you the ability to explore data and models in ways you never considered. I stumbled upon one such package yesterday.
olsrr appears to have been released late last year, so i am pleased did not live out in the wild for too long before i found it. The last post having been on forward and backward stepwise regression, olsrr is the perfect continuation of that post. Not surprisingly the author used the exact same data set i did for his samples, mtcars. With that there is nothing i can really add. Here is the link to the Variable Selection Methods.
I like the detail that the package goes into when explaining stepwise. Stepwise is awesome, but one thing i skipped over that is covered at the very top of the post is the dimensionality problem that can occur with stepwise. I used a total of 10 variables int eh trained model, that equates to 210, which is a lot, and its super slow to calculate that many models. What if your model had 100 variables and 100,000 rows in the training set? You are not going to do that on your laptop, but this will happen and you will solve it, scale out is your friend in this case.
The more you read, the more you experiment and follow along, and the more data you try these features out on the better you will get and the better you will understand.
More variables! For this one we are going to add all of the variables in their correct form in the data frame as qualitative or quantitative.
If you starting with this post, lets get the data loaded up, fix the column names, convert factors to a type of factor, and create a column for out non imperial friends so they can understand the mpg thing. Continue reading →