Hopefully, when you are done running through this you will have something like this. All jobs that have been running longer than x minutes over a 24 hour period and what jobs they overlap, which is not trivial if you are looking at management studio output. You can also use the facet_wrap that you were introduced to in the last blog to look at one job over weeks and months.

R Script for this is here on github, grab it and walk along with the blog.
First things first, querying agent history and doing anything with the data has long been a giant pain in the ass. The problem is, it easy for Microsoft to fix but it would break an untold number of scripts that have been written over the last 20 years. The problem is the date, of which I will show the problem below. Thanks to a studious student in one of my talks I learned there is an “undocumented” though not hidden very well function in msdb called agent.datetime() that will get around the problem for you. However the proc i use to retrieve the agent history does not take advantage of it. I’ve been doing it the hard way all of these years, duh! I will today too by the way. I may put out an abbreviated version of the code at a later date, more interested in getting the post out than it being perfect.
So what is this problem? Normally when you want to store date time, you store it in a date time field in the format of year, month date, hour, minute, second, not like the following:
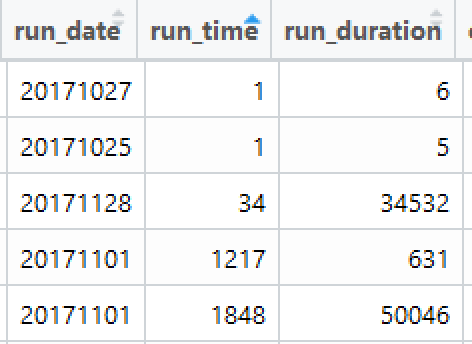
So what is this? Run_date is obvious, easily converted, but a run_time of 1? 34? 1217? And it is stored in SQL as an int. In this case, the first row translates to 2017/10/27 00:00:01 one second after midnight. 34 is 34 seconds after midnight “00:00:34”, and 1217 is 12 minutes and 17 seconds after midnight, “00:12:17”, and so it goes.
As I stated earlier, there is an msdb function dbo.agent_datetime that you can use in your query on the SQL side to do the work for you. You can run sp_helptext ‘dbo.agent_datetime’ if you want the text of the function. Based on the old style name I would guess it has been around as long as I have been manually converting the agent data time.
For this we will use brute force, my method is the long way, my methods always work but even I frequently feel like everything I write is the longest way, so know that going in. Though I will say the hoops you have to go through for R data time manipulation are pretty ridiculous, the public support forums seem to reinforce this.
Lets get to it. First install our packages if you have not already, same as yesterday, and then load them into R. If you have already installed these packages, just run the load using library(…)
#install.packages("odbc")
#install.packages("ggplot2")
#install.packages("dolyr")
#install.packages("lubridate")
#install.packages("scales")

library(odbc)
library(ggplot2)
library(dplyr)
library(lubridate)
library(scales)
library(plotly)
As we have done before, build your odbc connection query and go get your data! More comments inline this time so be sure to read them.
# My server is GMT, you may need your local timezone
Sys.setenv(TZ='GMT')

#Build connection
MSDB <- dbConnect(odbc::odbc(),
                 Driver    = "SQL Server",
                 Server    = "localhost",
                 Database  = "msdb",
                 Trusted_Connection = 'Yes')

# SQL Statement, i am lazy, i just use the agent history proc, it has every thing i need.
# the date parameter will return everything after the date provided
# So in this case, every job executed after 2017-10-01, so if you are reading this in 2020
# you might want to change it to something more recent.

SQLStmt <- sprintf("declare @date varchar(8)
    select @date = '20171001'
    exec sp_help_jobhistory @start_run_date = @date, @mode='FULL'")

rs <- dbSendQuery(MSDB, SQLStmt)

# Warning is normal in this case on a guid, can use
# try catch to deal with warning if you like
# https://github.com/r-dbi/odbc/pull/29

msdbAgentHist <- dbFetch(rs)

# house keeping
dbClearResult(rs)
dbDisconnect(MSDB)

# make a backup of the dataframe for testing
keepCopy <- msdbAgentHist
I know i have mentioned in past blogs about saving and reading, but if you want to save the dataframe you have read in, this will do it for you. If you have your laptop and are on the road, testing and running locally is much easier than conencting to SQL every time.
# Save an object to a file
#saveRDS(msdbAgentHist, file = "C:/Users/adminshep/Documents/msdbAgentHist.rds")

# Restore the object
#msdbAgentHist <- readRDS(file = "/Users/Shep/Azure Share/DSVM1/msdb/msdbAgentHist.rds")
Below there are variations of filtering based on a date, the first will give you anything greater than the maximum run date - 1, the second one will give you anything less than the minimum run date + 1, and the last one will give you anything that had a run start date of the one day indicated. Only need to run one of these. Also, i have a habit of constantly overwriting my current data frame, this is a really bad habit i developed when taking 40 files and joining them and performing ten pages of feature engineering to get the data where i wanted it. The downside, if you make a mistake you have to reload the dataframe. The upside is, less to clean up and track, either way be careful doing either.
#msdbAgentHist <- filter(msdbAgentHist, run_date >= max(run_date)-1)
#msdbAgentHist <- filter(msdbAgentHist, run_date <= min(run_date)+1)
msdbAgentHist <- filter(msdbAgentHist, run_date == "20171031")
This is a tiny bit of data engineering to get the data cleaned up and trimmed. In the first line if the run_duration is greater than 5 seconds i want to keep the data. This will trim out short fast running jobs that we do not care about. You may want to change this to one or two minutes, but remember at this point in the script the run_duration is still not formatted properly, it is a concatenation of h:m:s, not actual time. So if you were to filter out anything > 120, that would be 1 minute and 20 seconds. Don't worry, we are fixing it soon, so you may want to move this step to after the time conversions.
Also, the step_id zero is technically overhead and does not actually perform a task we are interesting in monitoring, so delete those rows.
#run_duration comes in as INT, so ? 5 in this case will be 5 seconds,
msdbAgentHist <- filter(msdbAgentHist, run_duration > 5)
msdbAgentHist <- filter(msdbAgentHist, step_id > 0)

# If the run_time = 0 that means its midnight, so lets clean it up first.
msdbAgentHist$run_time[msdbAgentHist$run_time == "0"] <- "000000"

# work on the dates, easy conversion for just YMD
msdbAgentHist$run_date <- ymd(msdbAgentHist$run_date)

# Converting to character will help in the next steps.
msdbAgentHist$run_duration <-as.character(msdbAgentHist$run_duration)
Create a set of empty columns fill them with XXX so we can know if we missed a row or column later on.
#Create a combined column with start date and time, create every possible need for date or time
msdbAgentHist$run_StartTime   <- "XXX"
msdbAgentHist$run_StartDate   <- "XXX"
msdbAgentHist$run_StartDateTime   <- "XXX"
msdbAgentHist$run_StartHour <- "XXX"
msdbAgentHist$run_EndTime   <- "XXX"
msdbAgentHist$run_EndDate   <- "XXX"
msdbAgentHist$run_EndDateTime   <- "XXX"
If you are following along and checking off items in your R skills toolbox, you can add for loop. This will go through and build the runtime column. This could be better as a function, or even an R package, Hmmm...
rows <- nrow(msdbAgentHist)
for (i in 1:rows){
  if (nchar(msdbAgentHist$run_time[i]) == 6){
    msdbAgentHist$run_StartTime[i] <-   format(strptime(msdbAgentHist$run_time[i], "%H%M%S"),format="%H:%M:%S")
  }

  else if (nchar(msdbAgentHist$run_time[i]) == 5){
    msdbAgentHist$run_time[i] <- paste("0", msdbAgentHist$run_time[i], sep='')
    msdbAgentHist$run_StartTime[i] <-   format(strptime(msdbAgentHist$run_time[i], "%H%M%S"),format="%H:%M:%S")

  }
  else if (nchar(msdbAgentHist$run_time[i]) == 4){
    msdbAgentHist$run_time[i] <- paste("00", msdbAgentHist$run_time[i], sep='')
    msdbAgentHist$run_StartTime[i] <-   format(strptime(msdbAgentHist$run_time[i], "%H%M%S"),format="%H:%M:%S")

  }
  else if (nchar(msdbAgentHist$run_time[i]) == 3){
    msdbAgentHist$run_time[i] <- paste("000", msdbAgentHist$run_time[i], sep='')
    msdbAgentHist$run_StartTime[i] <-   format(strptime(msdbAgentHist$run_time[i], "%H%M%S"),format="%H:%M:%S")
  }
  else if (nchar(msdbAgentHist$run_time[i]) == 2){
    msdbAgentHist$run_time[i] <- paste("0000", msdbAgentHist$run_time[i], sep='')
    msdbAgentHist$run_StartTime[i] <-   format(strptime(msdbAgentHist$run_time[i], "%H%M%S"),format="%H:%M:%S")
  }
  else if (nchar(msdbAgentHist$run_time[i]) == 1){
    msdbAgentHist$run_time[i] <- paste("00000", msdbAgentHist$run_time[i], sep='')
    msdbAgentHist$run_StartTime[i] <-   format(strptime(msdbAgentHist$run_time[i], "%H%M%S"),format="%H:%M:%S")
  }
}
This will take the run_date and turn it into something useful... Recall i mentioned R date manipulation is mess? It could be me though, but i doubt it.
#Format and store start time
msdbAgentHist$run_StartDateTime <- as.POSIXct(paste(msdbAgentHist$run_date, msdbAgentHist$run_StartTime), format="%Y-%m-%d %H:%M:%S")
msdbAgentHist$run_StartDate <- msdbAgentHist$run_date
msdbAgentHist$run_StartHour <- hour(msdbAgentHist$run_StartDateTime)
The next step is basically doing the same thing as the last section but now with run_duration. Recall i mentioned this would be a good R function? Maybe a later post i will provide that for you and a much smaller script to get all of this done. For now these are allgood excercise o see wha tthe data engineering pieces and parts look like, and don't be afraid to do them if needed, no data will ever be ready for you, its up to you.
#MSDB date is stored as actual time but not formatted, so turn it into date time
for (i in 1:rows){
  if (nchar(msdbAgentHist$run_duration[i]) == 6){
    msdbAgentHist$run_duration[i] <-   format(strptime(msdbAgentHist$run_duration[i], "%H%M%S"),format="%H:%M:%S")
  }

  else if (nchar(msdbAgentHist$run_duration[i]) == 5){
    msdbAgentHist$run_duration[i] <- paste("0", msdbAgentHist$run_duration[i], sep='')
    msdbAgentHist$run_duration[i] <-   format(strptime(msdbAgentHist$run_duration[i], "%H%M%S"),format="%H:%M:%S")

  }
  else if (nchar(msdbAgentHist$run_duration[i]) == 4){
    msdbAgentHist$run_duration[i] <- paste("00", msdbAgentHist$run_duration[i], sep='')
    msdbAgentHist$run_duration[i] <-   format(strptime(msdbAgentHist$run_duration[i], "%H%M%S"),format="%H:%M:%S")

  }
  else if (nchar(msdbAgentHist$run_duration[i]) == 3){
    msdbAgentHist$run_duration[i] <- paste("000", msdbAgentHist$run_duration[i], sep='')
    msdbAgentHist$run_duration[i] <-   format(strptime(msdbAgentHist$run_duration[i], "%H%M%S"),format="%H:%M:%S")

  }
  else if (nchar(msdbAgentHist$run_duration[i]) == 2){
    msdbAgentHist$run_duration[i] <- paste("0000", msdbAgentHist$run_duration[i], sep='')
    msdbAgentHist$run_duration[i] <-   format(strptime(msdbAgentHist$run_duration[i], "%H%M%S"),format="%H:%M:%S")

  }
  else if (nchar(msdbAgentHist$run_duration[i]) == 1){
    msdbAgentHist$run_duration[i] <- paste("00000", msdbAgentHist$run_duration[i], sep='')
    msdbAgentHist$run_duration[i] <-   format(strptime(msdbAgentHist$run_duration[i], "%H%M%S"),format="%H:%M:%S")
  }
}

# Divide date up by Date, Date time, and elasped time
msdbAgentHist$run_EndDateTime <- as.POSIXct(msdbAgentHist$run_StartDateTime,format="%H:%M:%S") + period_to_seconds(hms(msdbAgentHist$run_duration))
msdbAgentHist$run_EndTime <- format(msdbAgentHist$run_EndDateTime,format="%H:%M:%S")
msdbAgentHist$run_EndDate <- format(msdbAgentHist$run_EndDateTime,format="%Y-%m-%d")
msdbAgentHist$MinutesElapsed <- hour(hms(msdbAgentHist$run_duration)) * 60  + minute(hms(msdbAgentHist$run_duration))
I know you thought we would never be done screwing around with the data, but we are! The data engineering to get us to the graphic above is now complete. This graphic is a bit more complicated than those i have posted before, we actually build rectangles based on start and stop of a job, so we can get a sense of time. I will break down the entire command in future posts as it relates to ggplot and geom_rect more than what i am trying to cover today
ggplot(msdbAgentHist, aes(run_StartHour, run_StartDateTime)) +
  geom_rect(aes(ymin = run_StartDateTime,
                ymax = run_EndDateTime,
                xmin = (run_StartHour ),
                xmax = (run_StartHour + .75),
                fill=step_name,
                color=step_name))+
  scale_x_continuous(breaks = round(seq(min(msdbAgentHist$run_StartHour),
                                        max(msdbAgentHist$run_StartHour),
                                        by = 2))) +
  scale_y_datetime(date_labels = "%Y %b %d %H:%M:%S",
                   breaks = date_breaks("4 hour"),
                   minor_breaks = date_breaks("4 hour")) +
  theme(axis.text.x = element_text(angle = 90, hjust = 1))+
  theme(legend.key.size = unit(.5,"line")) +
  guides(fill=guide_legend(ncol=1)) +
  labs(title = "SQL Agent History", x = "Start Hour", y = "Duration")
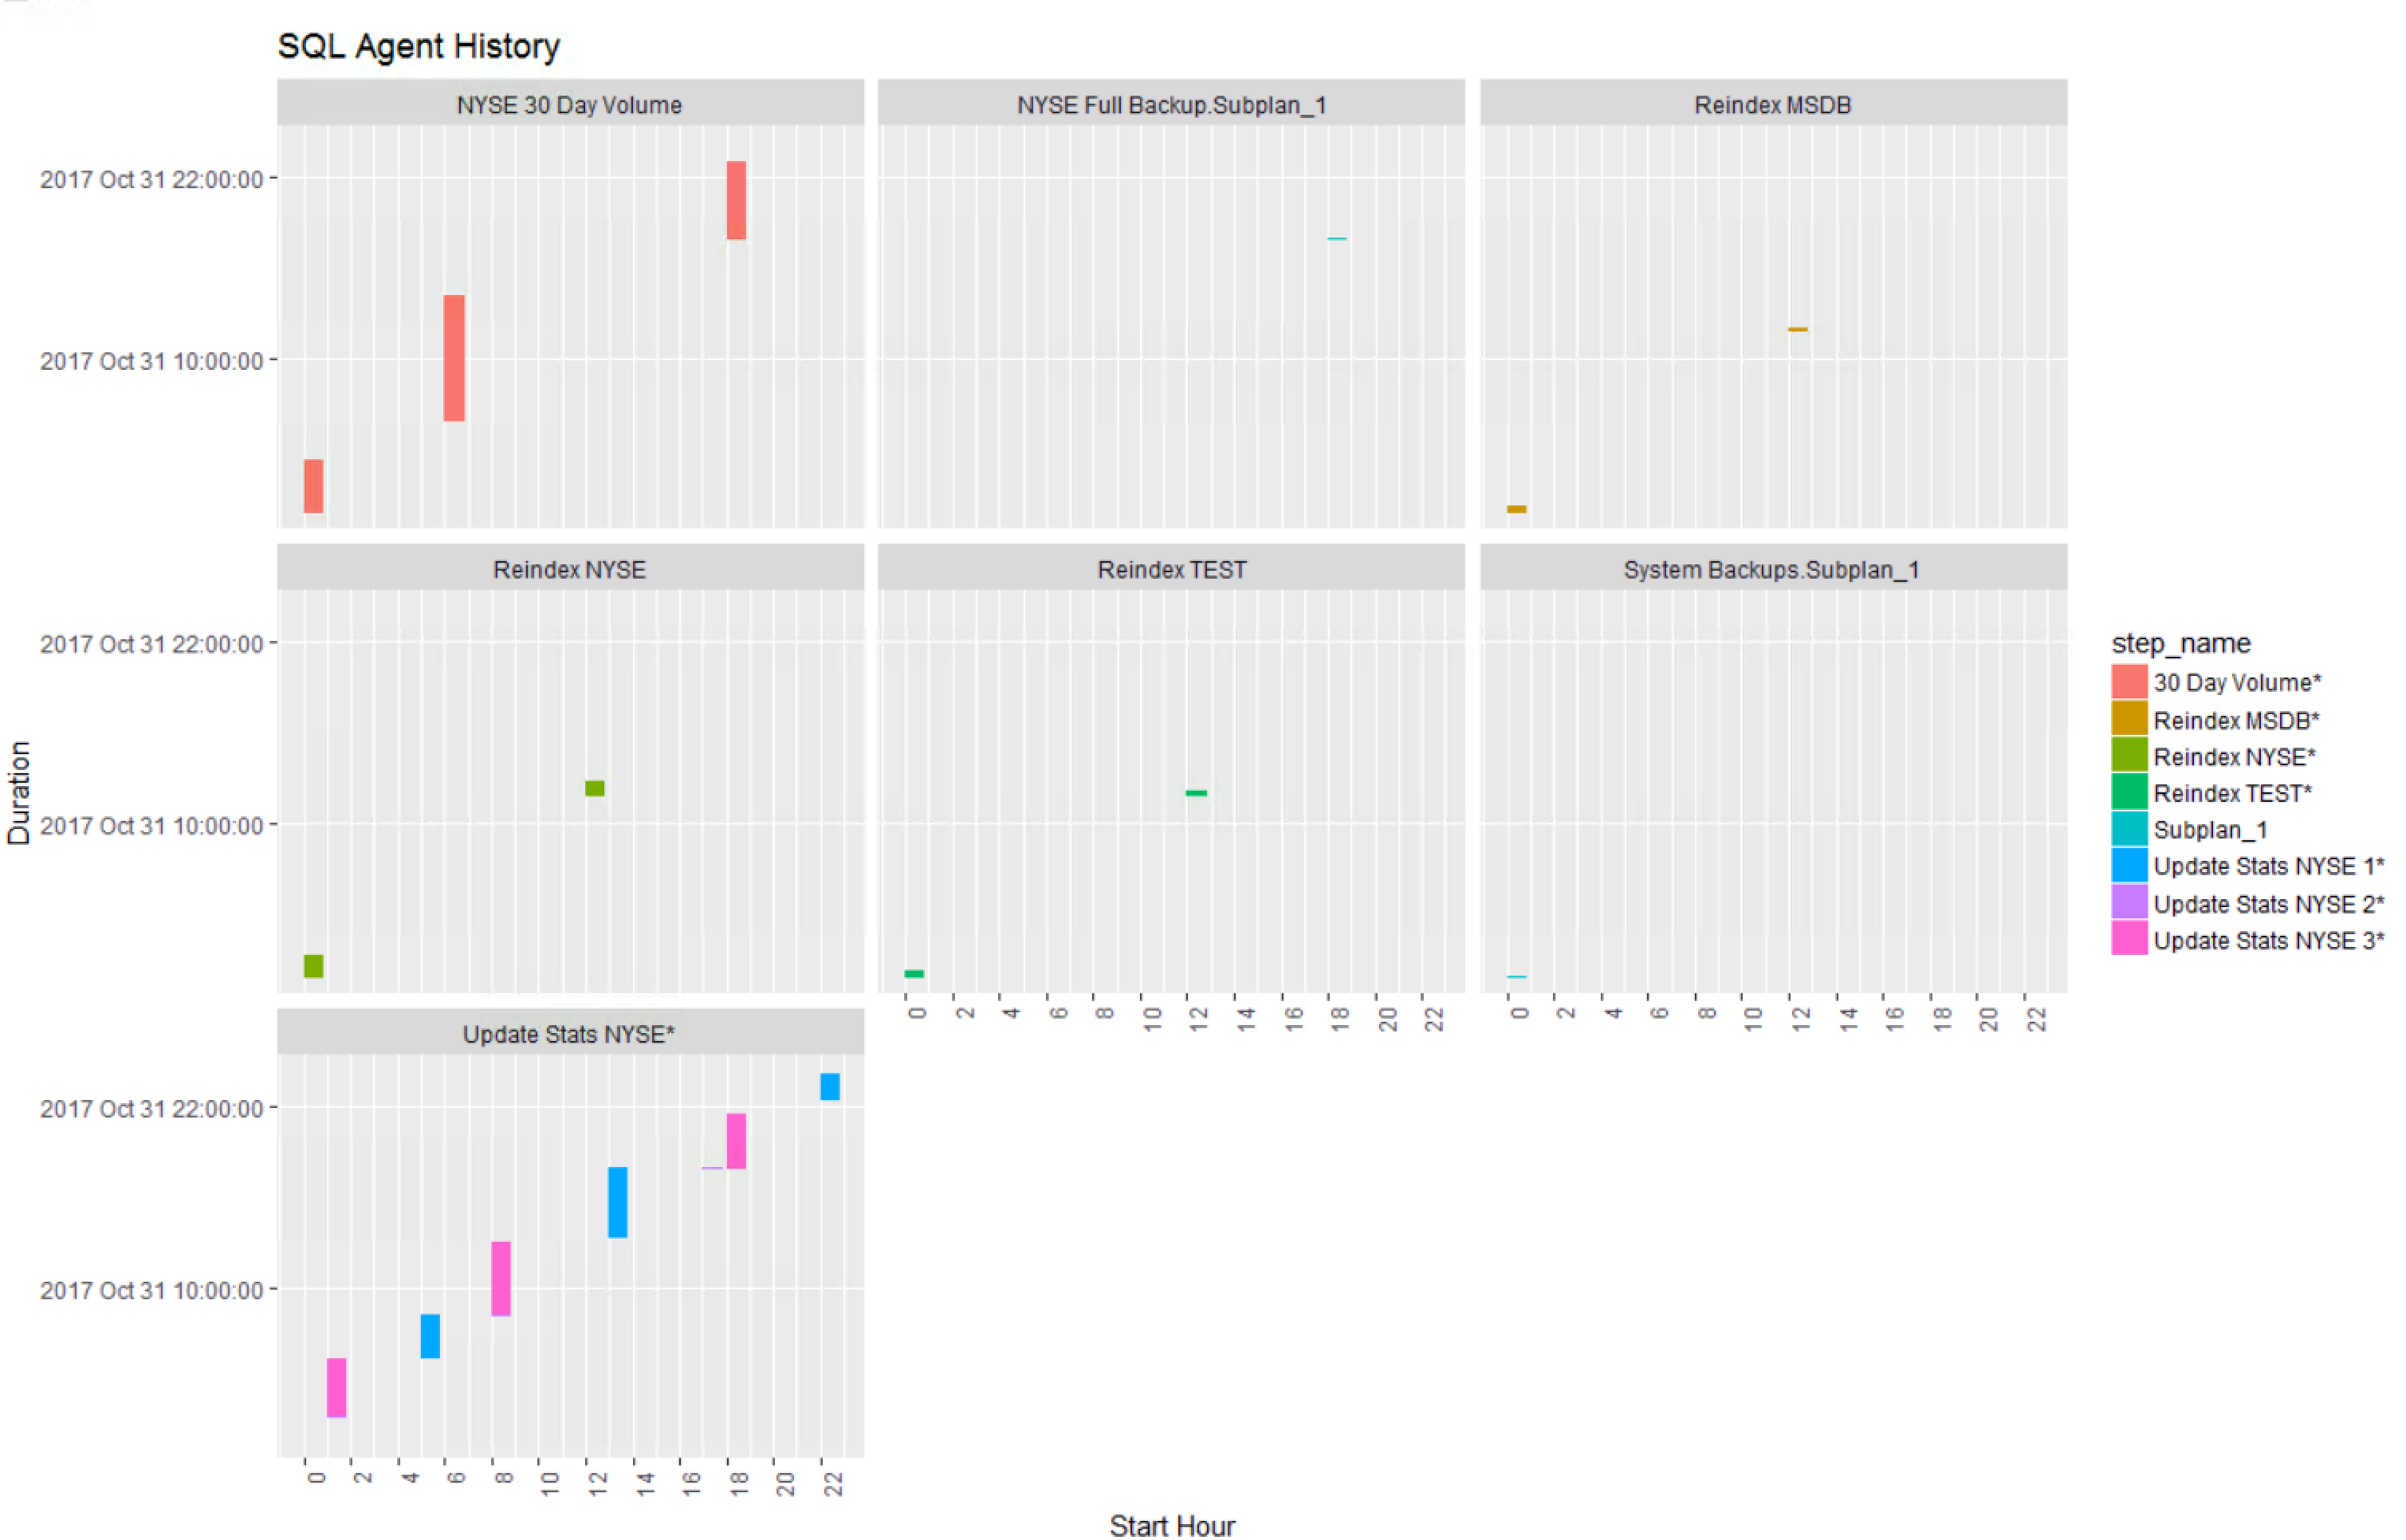
Next, lets add facet_wrap so that each job gets its own plot.
ggplot(msdbAgentHist, aes(run_StartHour, run_StartDateTime)) +
  geom_rect(aes(ymin = run_StartDateTime,
                ymax = run_EndDateTime,
                xmin = (run_StartHour ),
                xmax = (run_StartHour + .75),
                fill=step_name,
                color=step_name))+
  facet_wrap(~job_name) +
  scale_x_continuous(breaks = round(seq(min(msdbAgentHist$run_StartHour),
                                        max(msdbAgentHist$run_StartHour),
                                        by = 2))) +
  scale_y_datetime(date_labels = "%Y %b %d %H:%M:%S",
                   breaks = date_breaks("12 hour"),
                   minor_breaks = date_breaks("12 hour")) +
  theme(axis.text.x = element_text(angle = 90, hjust = 1))+
  theme(legend.key.size = unit(1,"line")) +
  labs(title = "SQL Agent History", x = "Start Hour", y = "Duration")
Once again, if you have 300 jobs, this will certainly blow out your plot, and again this would be a good task for a notebook which i will be providing very soon.