My last linear regression post i mentioned that most of the numbers come form the residual errors, thats not entirely true. You have a basic understanding of lm you learned that R-square is the number to look at, that is based on residual error. You are also told to examine the p-value for each coefficient and for the entire model. P-value is a little bit harder to calculate, go search and find out for yourself. But in lieu of that i am going to provide the actual calculation for everything you may have seen reference in an lm.
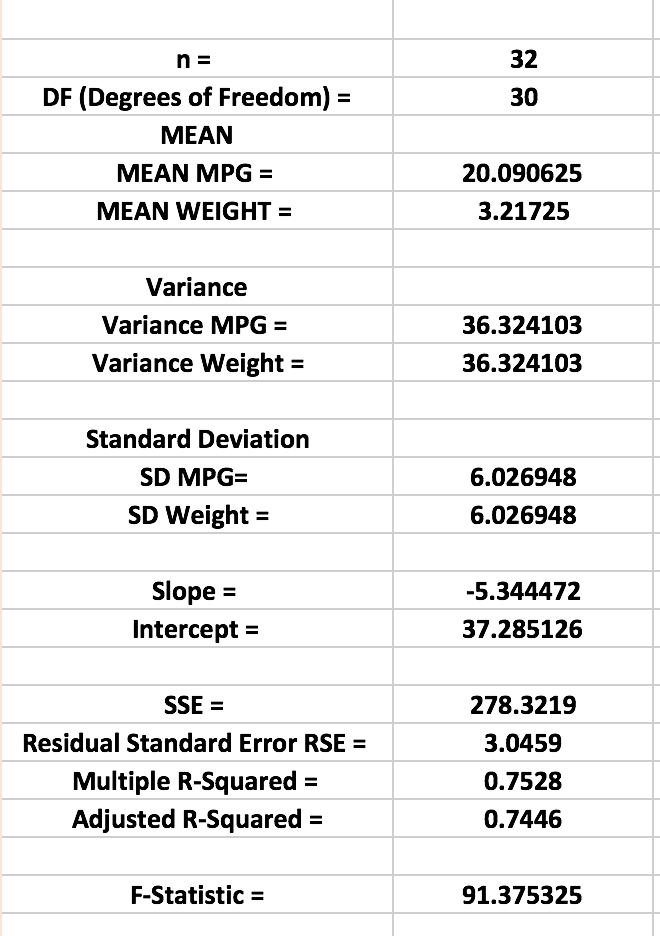
N,n: Upper case N is population size, lower case n is the sample size.
Degrees of Freedom: Short uncomplicated, answer is the number of cases(rows) minus the number of coefficients.
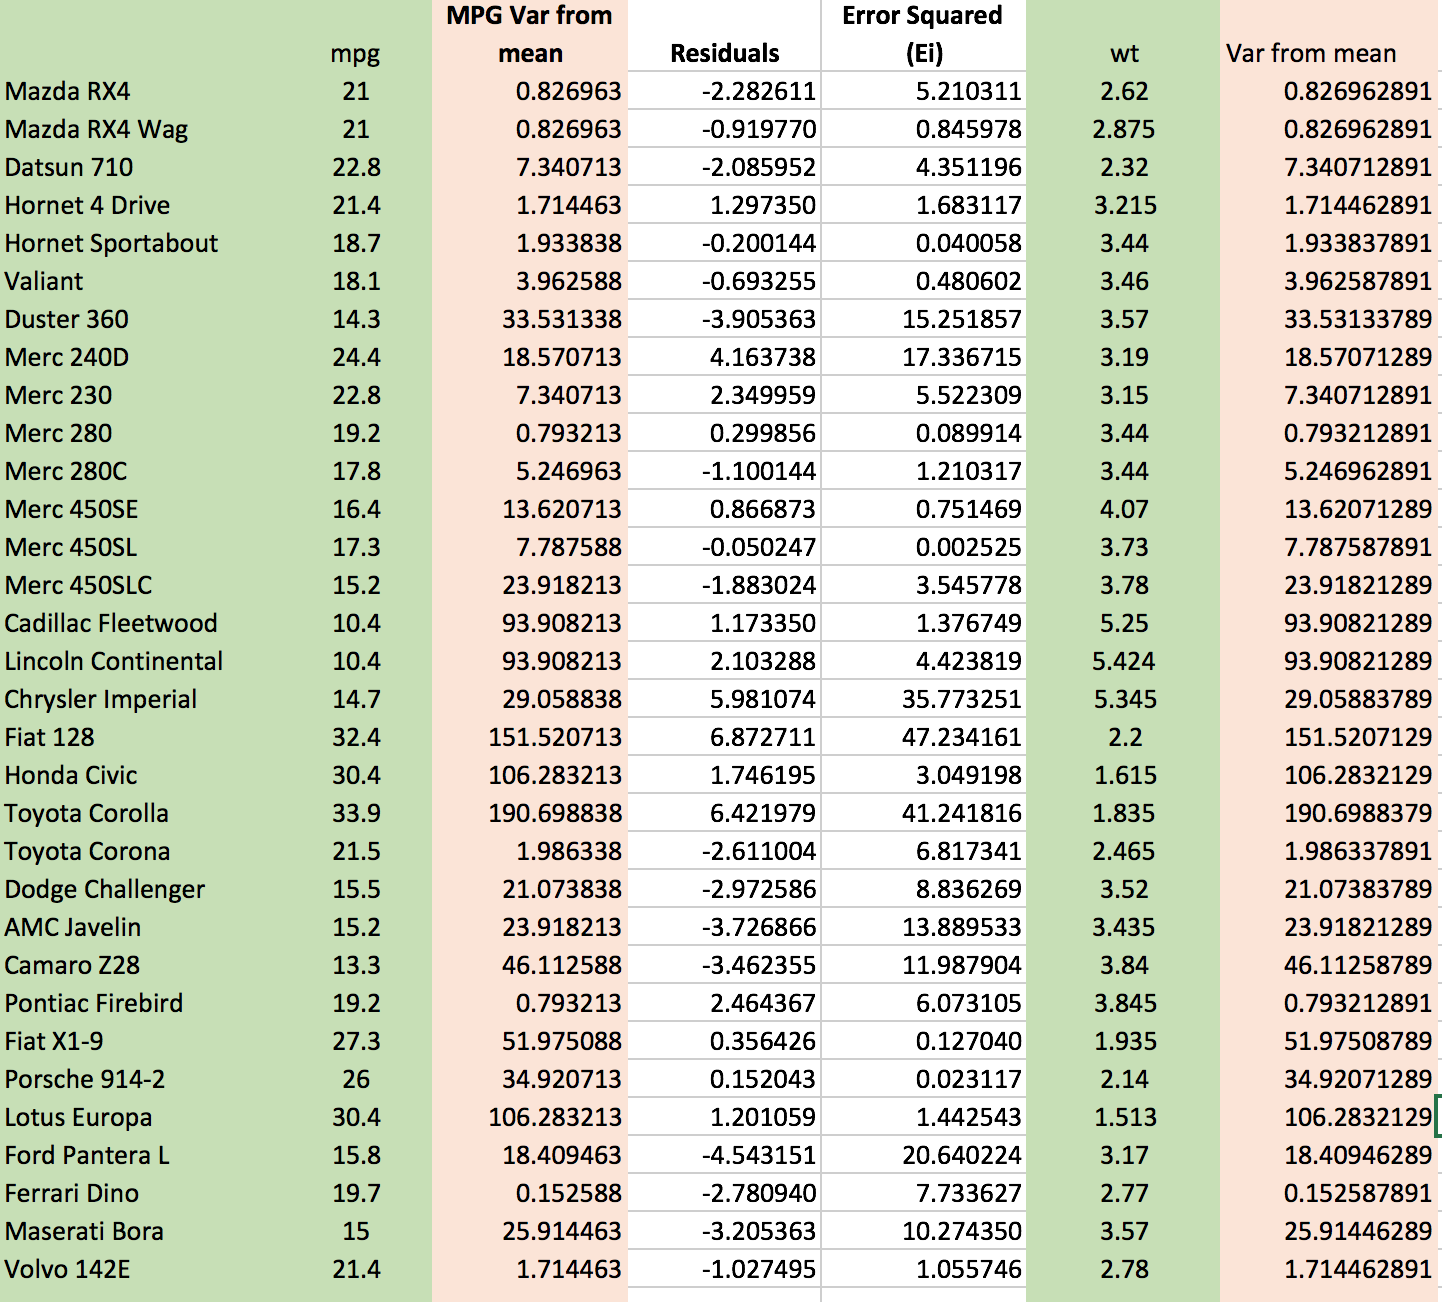
Mean: Average of a variable or column
Variance: (sum(mean mpg – mpg) / n-1)
Standard Deviation: sqrt(variance)
Residuals: mpg – (slope + intercept * weight)
Error Squared: Residuals^2
Residual Standard Error RSE: variance / degrees of freedom
SSE or Sum of Squared Errors: Sum(Error Squared)
Multiple R-Squared: 1-SSE/(sum(mpg – mean(mpg))^2)
Adjusted R-Squared: 1-SSE/(sum(mpg – mean(mpg))^2)*(n-1)/(n-(1+1))
Even i think this is ridiculous in a blog post, so i have included the excel spread sheet on my github site if you really want to know how all of this works. IF everything goes well these numbers will match what came out of the R summary of lm for mtcars with mpg as the predictor and weight as the explanatory variable.