If the title of the thing you are using is called confusion, stop and start over. Never will you need more proof that statistics is deliberately screwing with you and trying to keep you away until you disassemble a confusion matrix. In lieu of the name, lets give it some new names;
Bewilderment matrix, disorientation matrix, agitation matrix, befuddling matrix, perplexity matrix, i think you get the point…
So what it is it? From an Azure ML classification i am working on, lets take a look at just a tiny bit of it.


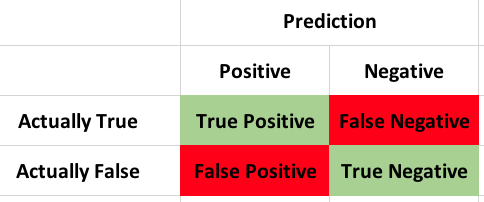
So, part of this makes sense, lets go through the definitions of each.
True Positive: Top left, In a prediction, these are the ones the model got right. For instance you are many many months pregnant and for some reason you decide to take a pregnancy test and it comes back positive, as it should, yay model!
True Negative: In the lower right are also the ones the model got right. For instance you are a 38 year old male and decide to take a pregnancy test and it comes back negative, as expected, yay model! Bit ridiculous but you get the point.
False Negative: This is one of two ways the model can blow it, a false negative is when the test result is actually true, but the prediction decided it was false. For instance you really are many months pregnant and the pregnancy test comes back negative. This is also known as a Type II error.
False Positive: Lastly is the false positive in the lower left of my matrix, this one indicates that the model predicted a true when it should have predicted a false, for instance, you are a 38 year old male, you take a pregnancy test and it comes back positive. Once again, a ridiculous example, but a biologically male human probably would not test positive for being pregnant. Now, that being said, it is possible for a male human to test positive on a pregnancy test for a specific tumor, while the test was inaccurate for pregnancy it may mean you need to get something checked out. Tumor notwithstanding and focusing just on a pregnancy test this is a Type 1 Error.
None of that appears to be terribly confusing, once you look at it, it makes a good bit of sense. But, i think we can make it worse. There is another two by two grid we have not looked at an di will say in three semesters of stats it was not discussed, though as i have stated before the stats professors goal is to typically get you through he class not cover everything extensively.
Accuracy This is also called the misclassification error, or accuracy. it is the (False Positives + False Negatives) / sample size. So;
(2557+5050) / (4253+5050+2557+8493) = 0.3737533 is the misclassification error.
To get the Accuracy subtract from 1.
1 – 0.3737533 = 0.6262467 (Accuracy)
Precision This is where confusion may start to kick in, the short version is; Precision is the proportion of positives that are classified correctly. In our case, True Positive / (True Positive + False Positive) so;
4253 / (4253 + 2557) = 0.6245228 (Precision)
Recall Is answering the question of how many are actually classified correctly. True Positive / (True Positive + False Negative)
4253 / (4253 + 5050) = 0.4571644 (Recall)
F1 Score the Azure ML doc state that the F1 Score is the harmonic mean of precision and recall, thus believed to be a good summary of the models ability to predict.
F1 = 2((Precision * Recall) / (Precision * Recall)) so;
2 * ((0.6245228 * 0.4571644)/(0.6245228 + 0.4571644)) = 0.5278968 (F1 Score)
Low and behold it worked and i did not have to use math notation. If you want to see that there are plenty of sites to confuse more. you can find out more about this in the AML Docs, but not much more…
More soon…