I learned logistic regression using SPSS, which if you have no plans to use SPSS in life its sort of a waste of time. My professor said “i don’t know how to do that in SPSS” a lot, professor also said look it up on google a lot too. I expected better from Harvard Extension, but after i found out how easy it is to teach a class there i suddenly wasn’t surprised. Point being, do as much research on instructors and professors before had as you possibly can, if there is no public data or this is the their first or second year teaching, maybe pass for something else. The class assembled and demanded a refund from Harvard btw, Harvard is a for profit private school, they did not amass a 37 billion dollar endowment by issuing refunds, so, buyer beware, and we did not get our money back.
Many schools offer “continuing education” that have some very legit classes, but if you have the ability, make sure the class is being taught by actual faculty, especially in a STEM field. Harvard Extension does have a significant number of Harvard Professors recycle their courses through the extension school, and i have never been disappointed with those, overwhelmed maybe, which is what i would expect to be, but never disappointed.
So what is logistic regression?
In Short its a way to predict a qualitative variable from qualitative and quantitative variables. It falls under the statistical learning domain of classification, there are more in there as well, but lets focus on one at a time.
When would i use it? Well, lets start with something simple, is my lawn brown or green right now, and you are not allowed to look at it. The predictor is binary, only two values, we can simplify it to isGreen = “Yes” or “No”. Lets imagine some explanatory variables that could help us answer the question of green, yes or no, and you cannot look at your lawn, you are on the beach in Bermuda and there is no webcam for your lawn. What variables might be useful in predicting this?
1. Temperature for the last 30 days
2. Rain or lawn watering for last 30 days
3. Tye of grass, winter or seasonal grass
4. Month of year, December-March is likely not green
5. Climate Region of the US
6. Brown or Green (our predictor from past observations)
So logically, it is somewhat easy to see that if it is January in the North East, the temperature is an average of 25 for the last 30 days, rain (snow) or no rain my grass will be brown. So, ideally we can feed this into a model and it can give us a yes or no if my grass is green. Make sense?
Hopefully you understand the concept, from data tell me yes or no, 0 or 1, Hillary or Trump (spoilers), brown or green. This is called binomial, but here is the deal with a binomial, while the end result is a straight binary answer, getting there is not, its an evolution or a curve. Think about your grass again, in most places you do not wake up one day with brown grass, though when fall hits it sure seems that way, its a progression, the temperature starts to drop every day, the rain my slow or turn to snow, December may be approaching. What will happen in the data is a slow curve from my grass is green, to maybe its green to maybe its brown to its brown. The fancy term is binomial distribution, demonstrated by cumulative distribution shown below, thank you Wikipedia.
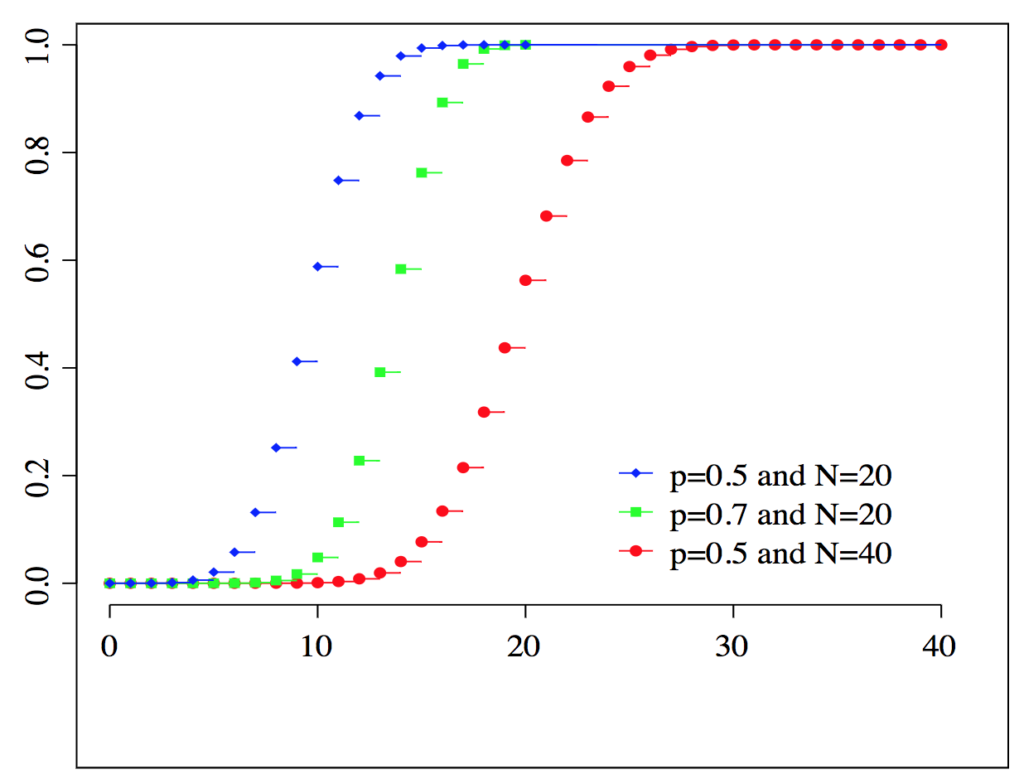
Don’t worry about the p-value and the n, but consider the lower left is yes my grass is green, and the top right is my grass is brown, as time passes, temperature drops and we enter winter, we move a long the line this tells us the probability that the grass is still green, until it is not, as you can well imagine there is a middle part basically between .2 and .8 on the y axis that falls into the category of we are not sure. For the purpose of our imaginary dataset, those numbers are the probability of the grass being green, in our case, green is zero and brown is 1. Anything in between is a probability of green or brown. So, not only can we get a yes or no, more importantly we get a probability. But, it is up to you to decide 0 or 1, if we decide that anything less than .3 is green and anything above .3 is brown, that will be the answer. While the input data did have a yes or no, we can move prediction of that yes or no up and down with the probability.
In math speak jibber jabber, p(y|x) What is the probability of y given x has occurred. What is the probability of green grass given the temperature has been 25 degrees for 30 days? You can take a probability class to be bombarded by this so i will save you from it for now.
Another example, which is a very popular example, hence the reason i avoided it first is, should you be given a loan? Since its you the answer is always yes, if you are asking your grandmother, if you are asking a bank, not so fast. Kaggle has some datasets on this, feel free to do your own exploration, i am undecided as of this writing if i will blog one or not. But, think about the loan, the outcome is yes or no, the inputs for bank to decide are credit score, employed yes or no, income, number of current open credit accounts, own or rent a home, though that is tied up in credit score, it will be really high if you own over rent.
Next post we will start with some real data, and hopefully more interesting than green lawn.
Pingback: Logistic Regression 2, the pictures - Data Science 2 Go LLC