So, we have covered standard deviation and mean, discussed central tendency, and we have demonstrated some histograms. You are familiar with what a histogram looks like and that depending on the data, it can take many shapes. Today we are going to discuss distribution that specifically applies to mound shaped data. We happen to have been working with a couple of datasets that meet this criteria perfectly, or at least it does in shape.
In the last blog, we had two datasets from US Educational attainment that appeared to be mound shaped, that being the key word, mound shaped. If it is mound shaped, we should be able to make some predictions about the data using the Empirical Rule, and if not mound shape, the Chebyshevs rule.
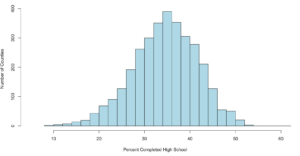
The point of this as stated in my stats class, to link visualization of distributions to numerical measures of center and location. This will only apply to mound shaped data, like the following;
When someone says mound shaped data, this is the text book example of mound shaped. This is from the US-Education.csv data that we have been playing with, below are the commands to get you started and get you a histogram.
Just so you fully understand wha this data is, every person in the US reports their level of educational attainment to the Census every ten years, every few years this data is updated and projected to estimate reasonably current values. This we will be using is for the 2010-2014 years which is the five year average compiled by the American Community Survey. I highly encourage use of this website for test data, all of it has to be manipulated a little bit, but it typically takes minutes to get it into a format R can use.
usa <- read.csv("/data/US-Education.csv",stringsAsFactors=FALSE)
str(usa)

#While not required, i want to isolate the data we will be working with
highSchool <- subset(usa[c("FIPS.Code","Percent.of.adults.with.a.high.school.diploma.only..2010.2014")],FIPS.Code >0)

#reanme the second column to something less annoying
colnames(highSchool)[which(colnames(highSchool) == 'Percent.of.adults.with.a.high.school.diploma.only..2010.2014')] <- 'percent'

#Display a histogram
hist(highSchool$percent
    ,xlim=c(5,60)
    ,breaks=20
    ,xlab = "Percent Completed High School "
    ,ylab = "Number of Counties"
    ,main = ""
    ,col = "lightblue")
The Empirical rule states that
68% of the data will fall with in 1 standard deviation of the mean,
95% of the data will fall within 2 standard deviations of the mean, and
99.7% of the data will fall within 3 standard deviations of them mean.
Lets find out!
#create a variable with the mean and the standard devaiation
hsMean <- mean(highSchool$percent,na.rm=TRUE)
hsSD <- sd(highSchool$percent,na.rm=TRUE)

#one standard deviation from the mean will "mean" one SD
#to the left (-) of the mean and one SD to the right(+) of the mean.
#lets calculate and store them

oneSDleftRange <- (hsMean - hsSD)
oneSDrightRange <- (hsMean + hsSD)

oneSDleftRange;oneSDrightRange


##[1] 27.51472 is one sd to the left of the mean
##[1] 41.60826 is one sd to the right of the mean

#lets calculate the number of rows that fall
#between 27.51472(oneSDleftRange) and 41.60826(oneSDrightRange)
oneSDrows <- nrow(subset(highSchool,percent > oneSDleftRange & percent < oneSDrightRange))

# whats the percentage?
oneSDrows / nrow(highSchool)
If everything worked properly, you should have seen that the percentage of counties within one standard deviation of the mean is "0.6803778" or 68.04%. Wel that was kinda creepy wasn't it? The empirical rule states that 68% of the data will be within one standard deviation.
Lets keep going.
#two standard deviations from the mean will "mean" two SDs
#to the left (-) of the mean and two SDs to the right(+) of the mean.
twoSDleftRange <- (hsMean - hsSD*2)
twoSDrightRange <- (hsMean + hsSD*2)


twoSDleftRange;twoSDrightRange

##[1] 20.46795 is two sds to the left of the mean
##[1] 48.65503 is two sds to the right of the mean

twoSDrows <- nrow(subset(highSchool,percent > twoSDleftRange & percent < twoSDrightRange))

twoSDrows / nrow(highSchool)
If your math is the same as my math, you should have gotten 95.09%, so far the empirical rule is holding...
What about three standard deviations?
threeSDleftRange <- (hsMean - hsSD*3)
threeSDrightRange <- (hsMean + hsSD*3)

threeSDleftRange;threeSDrightRange

threeSDrows <- nrow(subset(highSchool,percent > threeSDleftRange & percent < threeSDrightRange))

threeSDrows / nrow(highSchool)
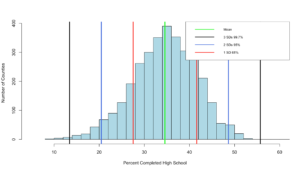
99.32% at three standard deviations, its like the empirical rule knows our data! Before we move on, lets add some lines...
hist(highSchool$percent
     ,xlim=c(5,60)
     ,breaks=20
     ,xlab = "Percent Completed High School "
     ,ylab = "Number of Counties"
     ,main = ""
     ,col = "lightblue")

abline(v = threeSDleftRange,col = "black",lwd = 3)
abline(v = threeSDrightRange,col = "black",lwd = 3)

abline(v = twoSDleftRange,col = "royalblue",lwd = 3)
abline(v = twoSDrightRange,col = "royalblue",lwd = 3)

abline(v = oneSDleftRange,col = "red",lwd = 3)
abline(v = oneSDrightRange,col = "red",lwd = 3)

abline(v = hsMean,col = "green",lwd = 4)


legend(x="topright",
       c("Mean","3 SDs 99.7%", "2 SDs 95%", "1 SD 68%"),
       col = c("Green","black", "royalblue", "red"),
       lwd = c(2, 2, 2),
       cex=0.75
       )
You can see the distribution of the data below, it really does seem to fall into pretty predictable standard deviations.
It has frequently been my opinion and others that R was written by an angry teenager to get even with his boomer parents, while not entirely true R has many frustrations. The nice thing is, you can write your own package to handle many of these more complex visualizations, i stuck to Base R for this histogram, and it does get the point across, but ggplot provides much better graphics and legends.
More Chebyshev in the next post!
Shep

