Yeah, levels were cute at Christmas i’m over it, lets do some prediction.
This whole series of posts started because the regression and data from the mtcars test data provided was useless as predicting the mpg of my truck, looking at the dataset it is not hard to figure the dataset is useless for any modern vehicle, to be fair it was not meant to be.
I admit the way the data is now, there will be some overfit for some parameters, as that is not the purpose of this exercise i am not going to worry about it. I think this will be a very good dataset to review in the future to deal with overfit issues.
Getting you caught up from the last few blogs, load the data and create a model.
epaMpg <- read.csv("epaMpg.csv",stringsAsFactors=FALSE)

summary(epaMpg)

epaMpg$Cylinders <- as.factor(epaMpg$Cylinders)
epaMpg$Tested.Transmission.Type.Code <- as.factor(epaMpg$Tested.Transmission.Type.Code)
epaMpg$Gears <- as.factor(epaMpg$Gears)
epaMpg$Test.Procedure.Cd <- as.factor(epaMpg$Test.Procedure.Cd)
epaMpg$Drive.System.Code <- as.factor(epaMpg$Drive.System.Code)
epaMpg$Test.Fuel.Type.Cd <- as.factor(epaMpg$Test.Fuel.Type.Cd)

epaMpg <- epaMpg[!is.na(epaMpg$Cylinders),]

# scipen will just blow out the  scientific notation, i like to see the number.
options(scipen = 999)

# this should be familiar by now.
epaMpg.1 <- lm(FuelEcon ~ HorsePower + Cylinders + Tested.Transmission.Type.Code + Gears + Drive.System.Code + Weight + AxleRatio + Test.Procedure.Cd + Test.Fuel.Type.Cd,data=epaMpg)

summary(epaMpg.1)
First we need to create a data frame with our "New Data". The dataset and the value types need to match what was originally passed into the model, so there is a little bit of work to get this right the first time.
HorsePower <- c(395,1500,70)
Cylinders <- as.factor(c(8,16,4))
Tested.Transmission.Type.Code <- as.factor(c("A","SA","CVT"))
Gears <-as.factor(c(8,8,1))
Drive.System.Code <- as.factor(c(4,"A","F"))
Weight <- c(5500,4750,2800)
AxleRatio <-c(3.21,3.64,3.2)
Test.Procedure.Cd <- as.factor(c(90,90,90))
Test.Fuel.Type.Cd <- as.factor(c(61,61,61))


newcars = data.frame(HorsePower,Cylinders,Tested.Transmission.Type.Code,Gears,Drive.System.Code,Weight,AxleRatio,Test.Procedure.Cd,Test.Fuel.Type.Cd)

View(newcars)
Using our new dataframe lets run a prediction
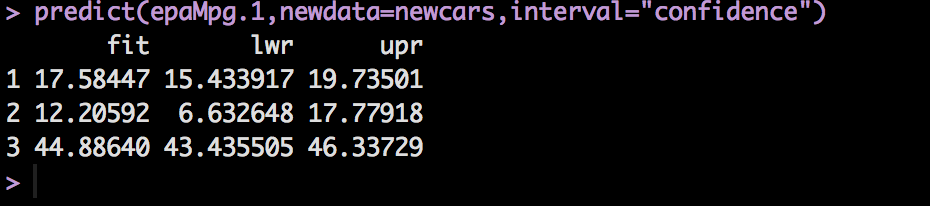
predict(epaMpg.1,newdata=newcars,interval="confidence")From this we get the the estimate and the 95% confidence interval of the prediction, imagine it as the possible range.
Using your spelunking skills add your vehicle to the list above and see what you get.