My last linear regression post i mentioned that most of the numbers come form the residual errors, thats not entirely true. You have a basic understanding of lm you learned that R-square is the number to look at, that is based on residual error. You are also told to examine the p-value for each coefficient and for the entire model. P-value is a little bit harder to calculate, go search and find out for yourself. But in lieu of that i am going to provide the actual calculation for everything you may have seen reference in an lm.
Continue reading
Category Archives: R
Linear Regression Level 101
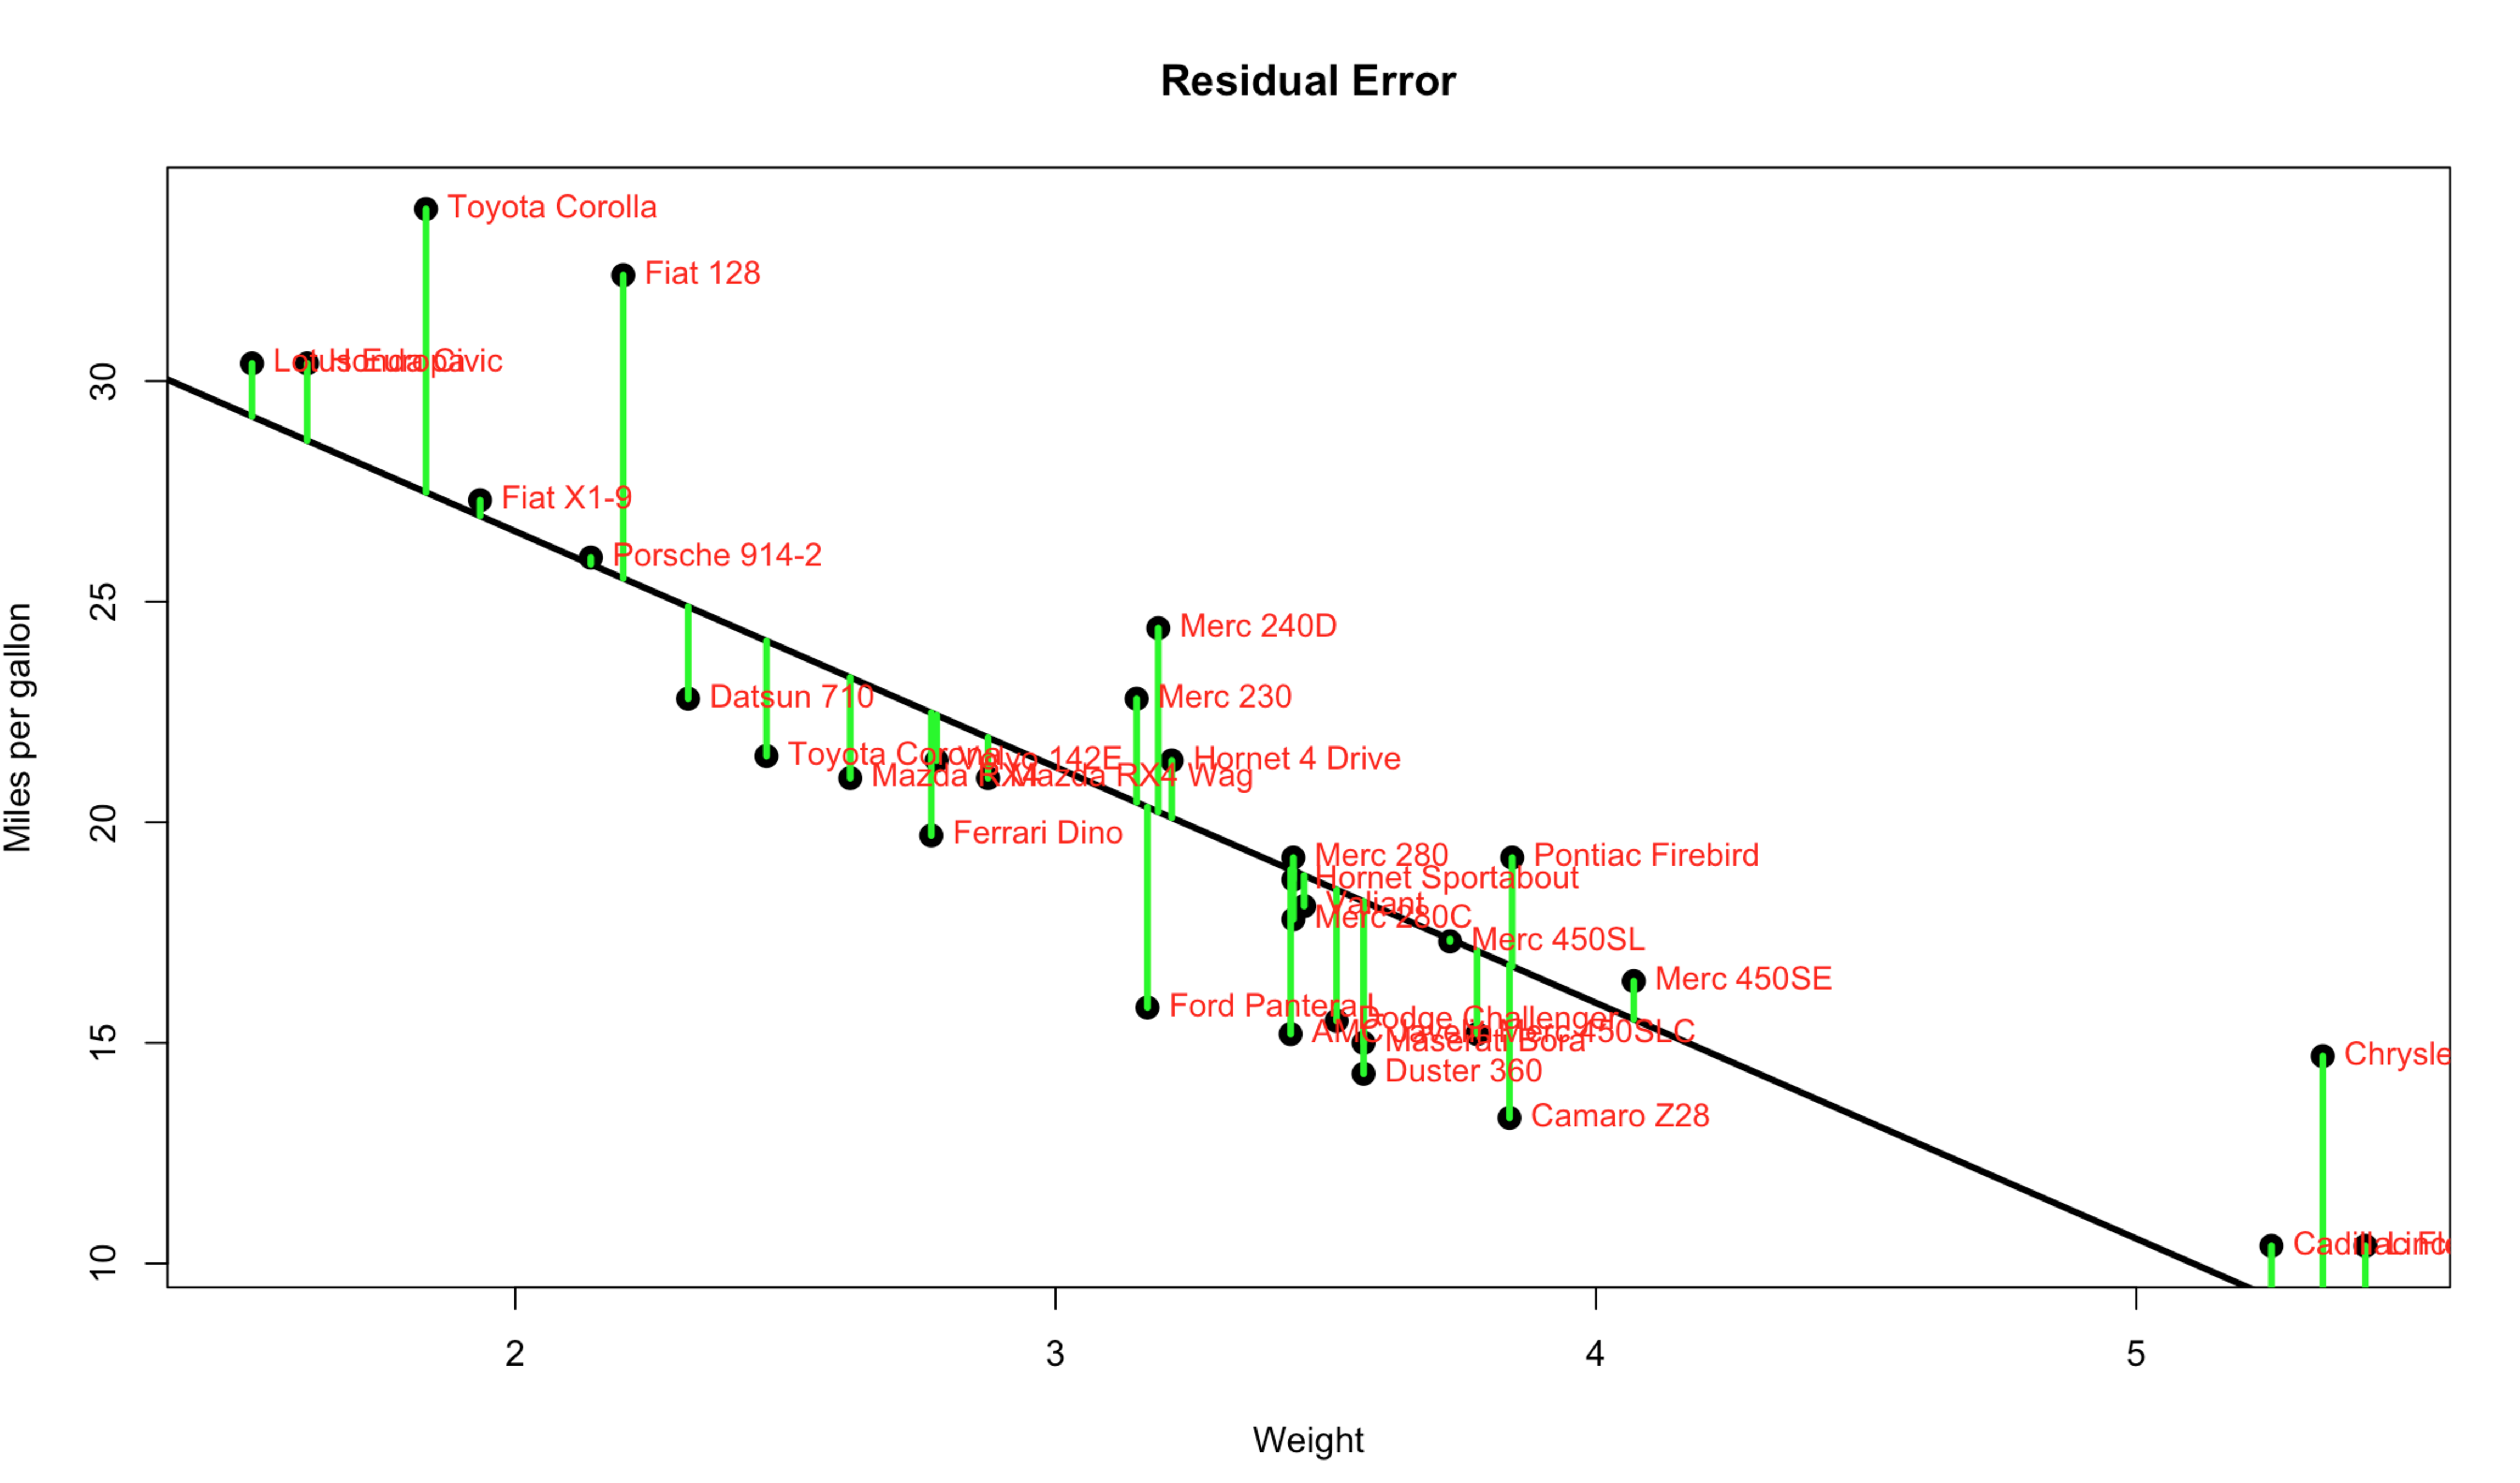
Published December 20, 2017 / by shep2010All the numbers, so many numbers, do we really need all of them…? If you want to make a an informed decision yes, you do. On the bright side they are not very hard to interpret, almost all of the numbers are related to just one number… The Error, more specifically the Residual Error. I’m going to blow your hair back again, its not an error, its nothing like and error, it should have never been called an error, its a difference. It is the difference between the line we ran through the middle of the scatter plot and the data points. Each point has a difference between the line and where the dot falls. Take a look at the visual below, the green line represents the distance between the line and the actual data point, thats our residual error. Its not hard to see that the larger the distance between the line and the data points the worse our model will perform. Not to mention the closer the data is to the the better.
Linear Regression Level 100
Published December 19, 2017 / by shep2010I think it’s difficult for a professor or teacher to know at exactly what point should linear regression be taught in a curriculum, it seems like it turns up everywhere calculus, algebra stats, modeling. It should be in all of them, but then the next question is do you need to know algebra, matrix algebra and linear algebra before knowing how to do a linear regression? I don’t know to be honest. Having worked with SQL for most of my adult life I have had to know and use all three and did not pay much attention to it or realize until I started formally beefing up my academics.
Regardless, the one thing I have heard from a few stats instructors is “don’t worry about how its done or how it works, the software will take care of it for you”, to be fair, these were not stats professors at the local beauty college, these were ivy league educated (I checked) professors and teachers saying this. Which, my problem is if I don’t know how it works I will probably not truly understand it, ever. Depending on what you are doing a trivial knowledge may be sufficient, but what if it’s not? If I am in an interview can I use the words “the software will do it for me” as the answer to a hard question?
What?
In the next few posts, I will do my best to define Linear Regression in R using lm. Continue reading
Visualizing SQL Server Agent History with R and ggplot
Published December 15, 2017 / by shep2010Hopefully, when you are done running through this you will have something like this. All jobs that have been running longer than x minutes over a 24 hour period and what jobs they overlap, which is not trivial if you are looking at management studio output. You can also use the facet_wrap that you were introduced to in the last blog to look at one job over weeks and months.

R Script for this is here on github, grab it and walk along with the blog.
Learn R Now, again
Published December 6, 2017 / by shep2010![]()
One of the hardest things about learning anything new is finding resources that are worth your time, don’t cost thousands of dollars, and don’t suck. One of the things i have not done and will not do is teach base R. I will do demos, i will explain some packages and functions along the way, but the basics of R are all free, and all range form pretty good to excellent. When you are in the early stages of learning anything, anyone that knows more than you is a resource for you. Just make sure they know wtf they are talking about, that part is harder. The next hardest part is use it everyday!
R and ggplot for SQL Server Backup History
Published December 5, 2017 / by shep2010Now that you have a connection from R to SQL, WOO HOO, what the heck do you do with it? Well for starters all of the reports that you wish Microsoft would write and ship with SSMS, now is your chance to do it yourself.
I will give you a few scripts every now and then just to get you started, I don’t have a production environment and I don’t have access to one so when I offer t-sql and R it will be from whatever data I can generate for a rudimentary test. If you have more data over a longer period of time, I may be interested in looking at it just to test out a bit. I am not going to write a system for you, but I can get you started. And i make no promises that when you run my code it wont blow chunks, my life time running joke is that i would never run my code in production, so i would certainly advise you not to either. Just consider everything i do introductory demos.
Getting Started with RevoScaleR Connectivity and SQL
Published November 30, 2017 / by shep2010In my head there is always a competition for which post is next and sometimes if there will be a post at all. ODBC and RevoScaleR have been arguing and its super annoying. ODBC was the last post, how you can connect to any version of SQL using just ODBC. If you did not go to the link I published, you can connect to Oracle, MySQL, PostgreSQL, SQLite too. The point of that will become much more clear when you start querying MSDB Job History so you can write your own R ggplot reports on job length and overlapping jobs (spoilers…). I will give you the code to get you started, later, maybe tomorrow, I don’t know yet depends on who wins the next argument. For now it is connect to SQL Server using RevoScaleR package…
Getting Started with R and SQL (Regardless of SQL Version) Using ODBC
Published November 29, 2017 / by shep2010So here you are, you know SQL or you at least do something with it everyday and are wondering what all the hoopla is about R and data science. Lets break down the first barrier, R and data science actually have little to do with each other, R is a language, data science is an abstract field of work, sort of like saying I am a computer scientist, that will narrow it down but not by much. What is your industry, what languages do you use, what is your education, hacker, bachelors, masters, phd…? You can be a Data Scientist and never use R.
But we are going to use R, today, right now, get ready.
Setting up a cloud Data Science test environment, on a budget
Published June 5, 2017 / by shep2010Before I get into another long diatribe, know that the minimum you need to get started with R is R, and R Studio and know that they will run on just about anything. But if you want a bit more of an elaborate setup including SQL, read on.
Many years ago I took great pride in having a half dozen machines or more running all flavors of windows and SQL to play with and experiment on, it did not matter what it was, it would bend to my will. And in case you are wondering, NT would run very nicely on a Packard Bell.
Once I took over the CAT lab I was in hog heaven, I had a six figure budget and was required to spend it on cool fast toys and negotiate as much free stuff from vendors as I possible could. It was terrible, tough job to have. Jump forward to now, I own one Mac Book pro and one IPhone, and serves every need I have.
Continue reading
Spring, SQL Intersections, and Posts
Published March 29, 2017 / by shep2010I have been in academic mode since January hence the lack of posts, on the bright side come June i will have a bout 40 posts minimum i will need to start pumping out, so look forward to that.
Much to read below, but fill out this survey if you please!
Continue reading