Spring SQL Intersections 2017 is over, to those who attended I hope you enjoyed the sessions and found everything presented useful! I led the Data Science track this spring and plan on presenting many more sessions in the years to come. I have presented before, and I have presented at intersections before, but this was my first foray into original data science content, or to be more accurate, statistical learning content.
How do I Data Science?
This was the subject of one of my first posts, I think it is far more realistic to add a skill a day to your toolbox using R or Python than to try and do what I did which was tackle the entire industry in one pass. But I am in a place in my career where that was the logical next step. As I stated in the conference, the most important question to ask to anyone trying to sell you a data science curriculum, is to ask; “If I take you course, will you hire me as a data scientist? ” Be sure to differentiate between skill building, or career building courses. As an example, Microsoft has Data Science curriculum on EdX.org(I am a huge fan of edx), but if you complete it, they will not hire you as a Data Scientist. That being said, I have no doubt that you will know far more than had you not taken the course. If you have a data science team in house, run training material by them as well, they are far more friendly that you would probably imagine.
As I go forward to teach, train, deliver content in person and online, I will be the first to tell you that I cannot make you a data scientist, but I can introduce it to you, teach you tools you do not have today, hopefully give you the ability to effectively communicate with DS folks in your organization, and by all of that, maybe you can work with them more. If it is a path you are interested in long term as a career, then focus on academics in a medium that is right for you.
Lots of questions came up, lots of good questions about data science and how to break in without going to school for the next twelve years. The easy and short answer is, do a little bit every day. R is shipping with SQL Server now, and even if it is not on a version you are using, there is still way for you to start using it. Download R, download R studio, and go find a getting started guide, or, use my blog to get you moving. In the next week I will be posting a blog on how to connect R to SQL Server and perform queries from within R, naturally the next thig to do is visualize it. I will be working on some graphics to trouble shoot SQL Server, if you have ever wanted a specific graphic for troubleshooting SQL, now is your chance to start thinking about it.
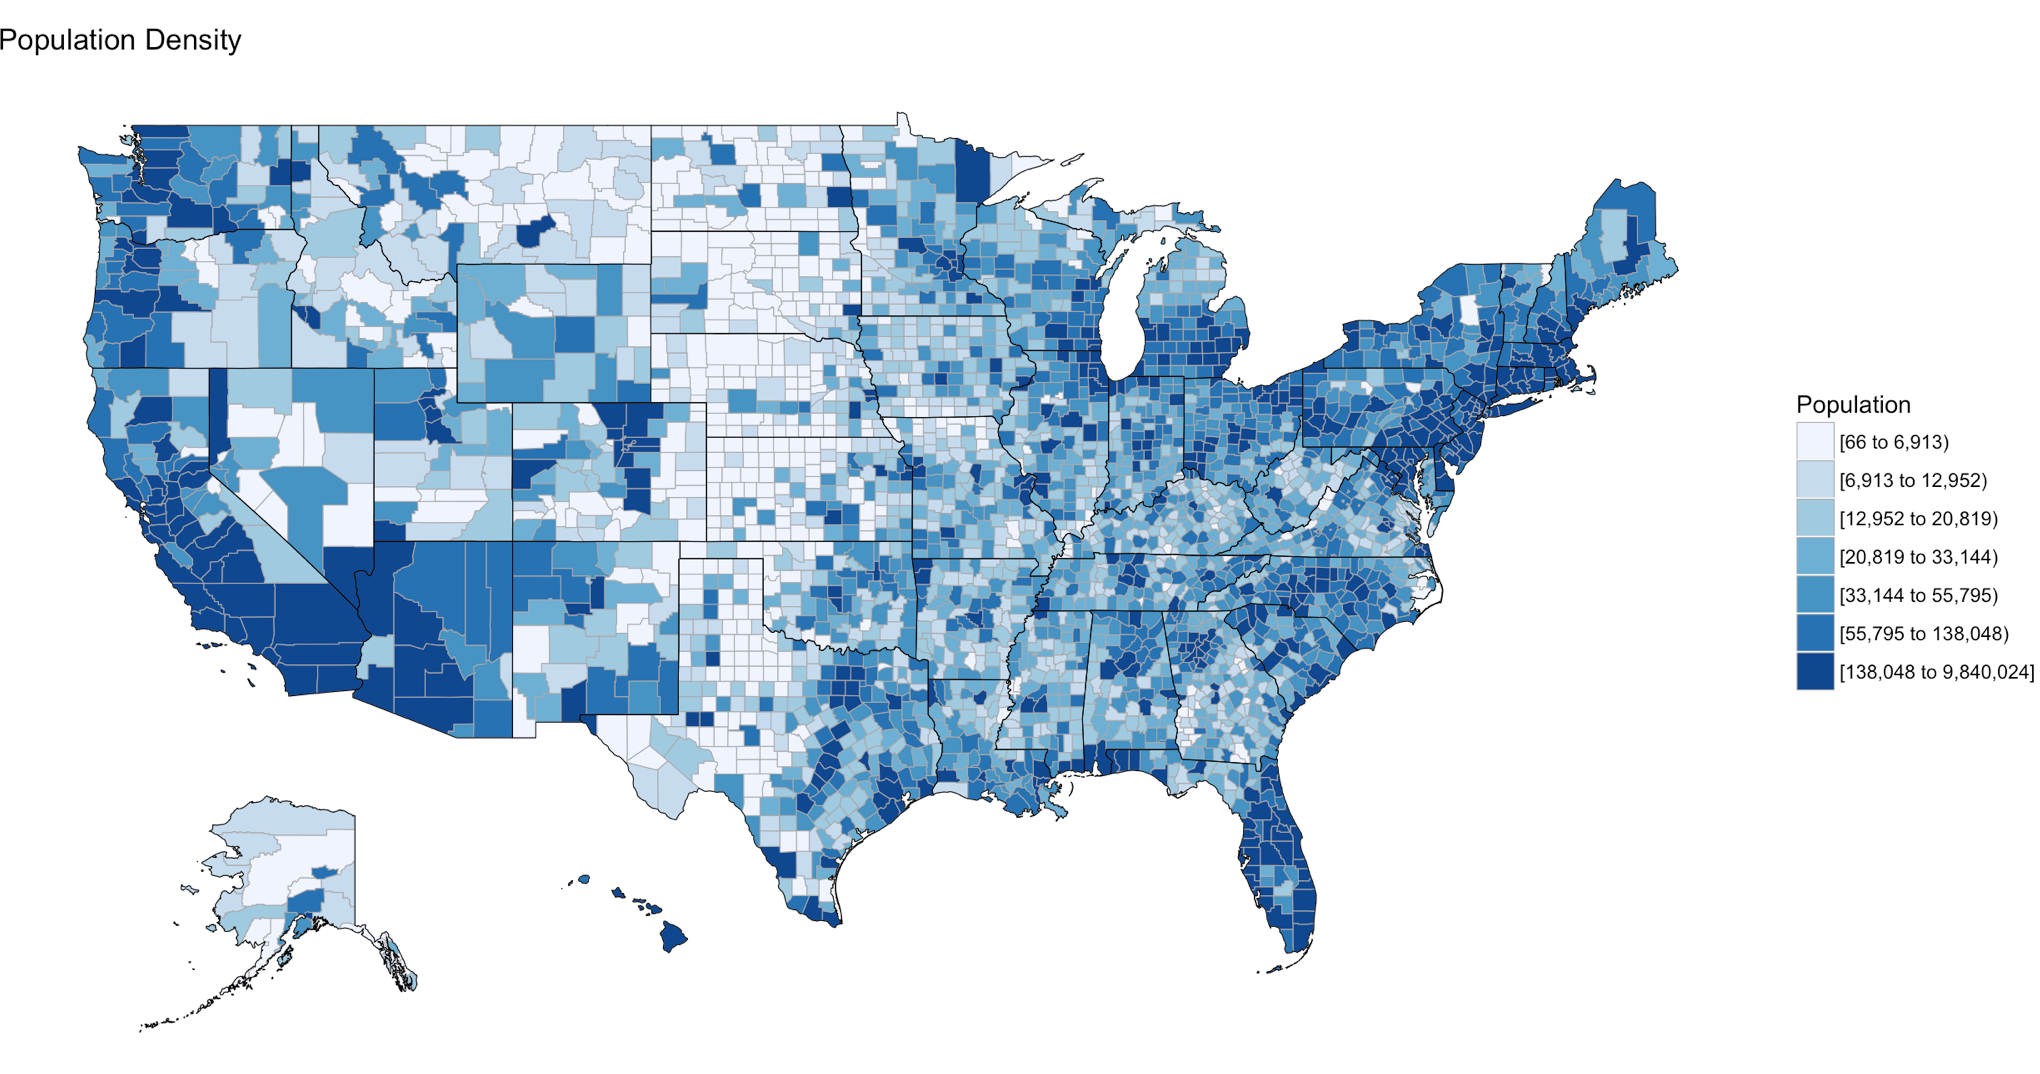
If troubleshooting or graphically analyzing SQL is not of interest to you, start with my visualization post, “Visualization, the gateway drug” Within thirty minutes you will be searching the web for all kinds of data you can map. The point is just start! Unfortunately, R can have some version issues with packages, something SQL folks are used to, but to start with the Visualization post, the packages work with R Version 3.3.3 “Another Canoe”, and R studio 1.0.44, though R Studio is less important than the R version, remember they are different applications. Imagine R as an engine and R Studio as the IDE.
Don’t worry about Data Science, probability, statistics, or machine learning for now, just find a reason to start using R. These are the beginning steps of data exploration which is a huge part of Data Science, so don’t underestimate the how important it is to learn even the smallest things.
Also, join a meetup in your area, get on some mailing lists, then get off of them if they are not adding value to your life.
More to come!