Visualization is said to be the gateway drug to statistics. In an effort to get you all hooked, I am going to spend some time on visualization. Its fun (I promise), i expect that after you see how easy some visuals are in R you will be off and running with your own data explorations. Data visualization is one of the Data Science pillars, so it is critical that you have a working knowledge of as many visualizations as you can, and be able to produce as many as you can. Even more important is the ability to identify a bad visualization, if for no other reason to make certain you do not create one and release it into the wild, there is a site for those people, don’t be those people!
We are going to start easy, you have installed R Studio, if you have not back up one blog and do it. Your first visualization is what is typically considered advanced, but I will let you be the judge of that after we are done.
Some lingo to learn:
Packages – Packages are the fundamental units of reproducible R code. They include reusable R functions, the documentation that describes how to use them, and sample data.
Choropleth – is a thematic map in which areas are shaded or patterned in proportion to the measurement of the statistical variable being displayed on the map, such as population density or per-capita income.
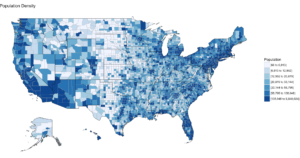
Below is the code for a choropleth, using the package choroplethr and the data set df_pop_county, which is the population of every county in the US.
This is what todays primary objective is;

To learn more about any R command “?”, “??”, or “help(“object”)” Keep in mind, R is case sensitive. If you can only remember part of a command name use apropos().
?str

?df_pop_county

??summary

help(county_choropleth)

apropos("county_")
#Install package called choroplethr,
#quotes are required,
#you will get a meaningless error without them
#Only needs to be installed once per machine
install.packages("choroplethr")
The library function will load the installed package to make any functions available for use.
library("choroplethr")To find out what functions are in a package use help(package=””).
help(package="choroplethr")
Many packages come with test or playground datasets, you will use many in classes and many for practice, data(package=””) will list the datasets that ship with a package.
data(package="choroplethr")
For this example we will be using the df_pop_county dataset, this command will load it from the package and you will be able to verify it is available by checking out the Environment Pane in R Studio.
data("df_pop_county")
View(“”) will open a view pane so you can explore the dataset. Similar to clicking on the dataset name in the Environment Pane.
View(df_pop_county)
Part of learning R is learning the features and commands for data exploration, str will provide you with details on the structure of the object it is passed.
str(df_pop_county)
Summary will provide basic statistics about each column/variable in the object that it is passed.
summary(df_pop_county)
If your heart is true, you should get something very similar to the image above after running the following code. county_choropleth is a function that resides in the choroplethr package, it is used to generate a county level US map. The data passed in must be in the format of county number and value, the value will populate the map. WHen the map renders it will be in the plot pane of the RStudio IDE, be sure to select zoom and check out your work.
#?county_choropleth
county_choropleth(df_pop_county)
There are som additioanl parameters we can pass to the function, use help to find more.
county_choropleth(df_pop_county,
                  title = "Population Density",
                  legend="Population")
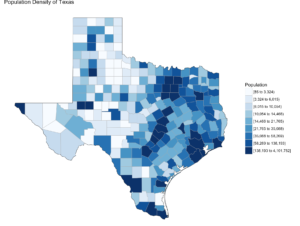
Try changing the number of colors and change the state zoom. If your state is not working read the help to see if you can find out why.
county_choropleth(df_pop_county,
                  title = "Population Density of Texas",
                  legend="Population",
                  num_colors=9,
                  state_zoom="texas")
There is an additional option for county_choropleth, reference_map. If it does not work for you do not fret, as of this blog post it is not working for me either, the last R upgrade whacked it, be ready for this to happen and make sure you have backs and versions, especially before you get up on stage in front 200 people to present.
There you have it! Explore the commands used, look at the other datasets that ship with choroplethr and look at the other functions that ship with choroplethr, it can be tricky to figure out which ones work, be sure to check the help for each function you want to run, no help may mean no longer supported. Remember that these packages are community driven and written, which is good, but sometimes they can be a slightly imperfect.
In the next post i will cover how to upload and create your own dataset and use the choroplethr function with your own data. On a side note, the choropleth falls under a branch of statistics called descriptive statistics which covers visuals used to describe data.
