Friend of mine asked about forecasting sales data, thought i would brush up on my skills a bit, sadly my life has been dominated by AI for the last 4 years, specifically LLMs. We all know, AI is an all encompassing term, not just LLMs. In my research i found TimesFM by Google Research, and guess what, its a transformer model, so yes “AI” is coming for your ML job! i guess it was just a matter of time.
I am going to go through what i learned, and the problems it does not solve, specifically data engineering, even with a transformer model data engineering the data set is going still be 80% of your job, unless you can outsource that to a baby data scientist? I’m available if you need me :-P.
What i tested was in BigQuery, figure it was fast and already there, and i happen to have a GCP account and have not played with BigQuery in a while so i thought it would be fun to brush up on my rusty SQL skills too. Here is the landing page for TimesFM, with a few excellent samples that i really enjoyed going through, i will not repeat what is already in the docs, to the best of my ability. But i do want to make some call outs and explain some stuff, for me as much as you!
Three options in the docs;
Univariate Model – A univariate model analyzes or predicts a single variable at a time, taking in historical data for that metric to output exactly one future prediction.
Multivariate Model – simultaneously predicts multiple interdependent target variables over time, capturing how they influence and correlate with one another.
Global Forecasting or Cross Learning Model – Yup, thats really the name, not exactly univariate, not exactly multivariate, multiple-multivariate. Looks at a whole group of different items at the same time—using multiple metrics to track each one—and outputs a unique future prediction for every item in that group all at once. Multiple input, multiple output. In the BigQuery Sample it takes taxi data, a few columns in, and outputs a few columns as well as prediction intervals( TimesFM uses quantile regression to output a range (lower to upper) where it expects tomorrow’s actual value to fall, it is chaotic ).
So for my unfiltered opinion! Overall, this is one of the coolest things i have seen, i played with the
Forecast a single time series with a TimesFM multivariate model for the entire weekend, here is what i found. The data is a dumpster fire, you can find it in BigQuery, public data sets, and that is what the sample code uses under iowa_liquor_sales, more specially bigquery-public-data.iowa_liquor_sales.sales.
Why is it a dumpster fire in my opinion? Keep in mind its a sample to get you up and running on TimesFM, i respect that, it worked, i got up and running and learned a bit of new stuff.
- The Data is not exactly great, there are missing Saturdays and Sundays and many weekdays through out the dataset. So if July 4 falls on a Friday there is no reporting of data for three days. So, if you pass in training data for the last 3 years, and ask it to project 14 days into the future, you will get an answer, but it will include weekends, which for what its worth thats exactly what we asked the model to do.
- There are a lot of negative values in the source sales table which are a bit of a mystery, they could be returns or exchanges, but the model will take that into account and give you a prediction interval that could be negative.
- The BIgQuery sample script does have a calculation to determine whether the date is a weekend or not, then pass in a 1 or 0, yay for that sample code, guess what there are no weekend days in the data.
For 1.5 years of training data, 01/01/2022 – 06/30/2023 here are the results for a 14 day forecast;
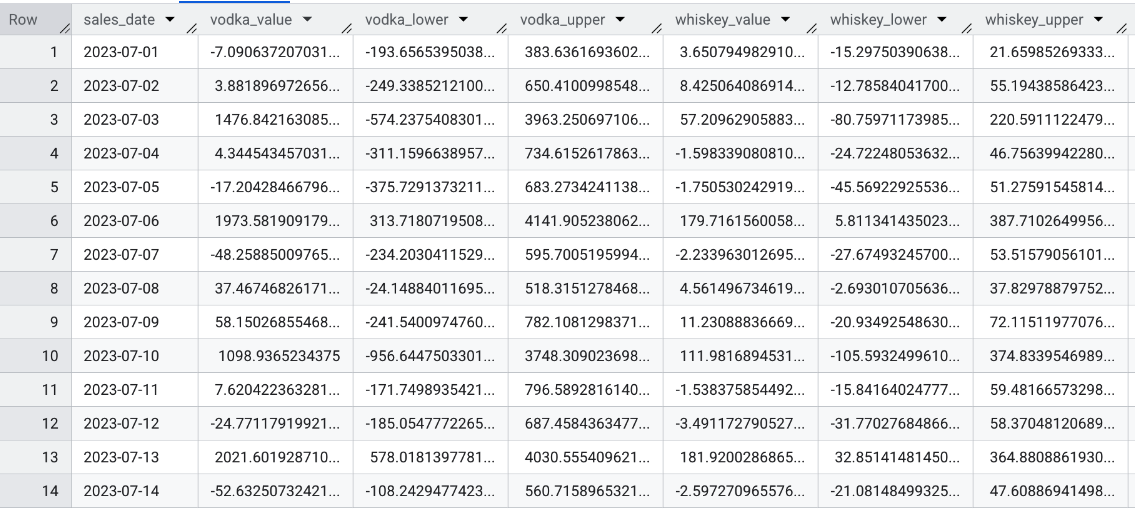
Overall, very very cool, took 20 seconds to run! Problem is what to do with weekends and negatives?
What about the accuracy though? Well back of the napkin math you can add up the 14 days, forecasted and add up the 14 days of actuals… Not very sciencey but i could not resist, we will get in to the metrics in a minute. Forecast vodka including negatives is 6532 actuals is 8840. So we under forecasted by 2308 bottles for two weeks. 🙁
So, back to data engineering, this forecast is for 1 store, store number 2633, i copied that table so i could play with just that store number and hopefully reduce some BigQuery costs as not to hit the public data table every time.
I added all days to the table that were missing, weekends, the random middle of the week day, and holidays here no data was collected and just zeroed out the values for those rows. But now we need to get into the actual metrics you are supposed to look at, WAPE, MAE, R2(because i like some R2) we did not do that on the last test, but we will for the next two.

Refresher
WAPE – Weighted Absolute Percentage Error, a demand planning metric that measures total forecast error as a percentage of total actual sales, naturally weighting high-volume products over low-volume items. So this one is specific to forecasting. The WAPE score we are looking for is 8-20(%)
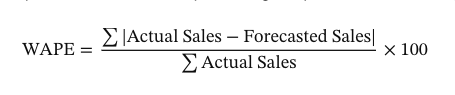
But, we also have MAE, which we know
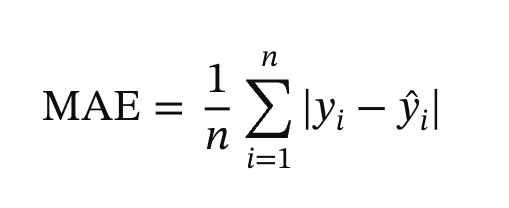
MAE – Mean Absolute Error in forecasting and machine learning, it measures the average size of your mistakes in a dataset, without considering their direction (whether your forecast was too high or too low). The formula is actually not as bad as it looks :-D. remember y hat, its in there.
R2 – R Squared – the Coefficient of Determination, measures the proportion of variance in the actual data that is predictable from your model’s inputs. For regression tasks its the bomb, guess what it sucks at? Forecasting and heres why, anecdotally; Retailers and supply chain planners cannot use an R2 score to buy inventory. A score of 0.85 doesn’t tell a procurement manager how many extra units of stock to order to prevent a stockout, whereas metrics like MAE (off by 5 units) or WAPE (off by 10% total volume) translate directly into business capital. And, you can get negatives.
With all of that in mind, why don’t we try weekly projections instead. So take the dataset collapse the daily into a week worth of purchase and forecast a weeks worth of products.

So what does WPAE really mean? Looking at the table below we have gone from Poor Needs work to Fair, thats a pretty good bump on vodka. But look at Whiskey we went from 84% to 19% which puts us in the Good range.
We are getting there! One other thing to keep in mind, we are not predicting specific bottles of Whiskey or Voka, we are predicting all types of whiskey and vodka, so the sample is flawed to begin with. You would never order 8000 bottles of vodka flavored vodka, its flavored vodka, imported vodka, American flavored vodka, and and plain old America vodka. The actual details are in the item_description, that is what you would really be predicting. For the record, there are 60 flavors of vodka at store 2633.
| Performance Level | WAPE Range | Accuracy Range | Typical Business Context |
| World Class | < 10% | > 90% | Highly predictable, fast-moving items at store/aggregate level. |
| Good / Reliable | 10% – 20% | 80% – 90% | Standard target for FMCG, grocery, and steady replenishment. |
| Fair / Acceptable | 20% – 35% | 65% – 80% | Typical for general retail across broad SKU portfolios. |
| Poor / Needs Work | > 35% | < 65% | Signals high stockouts, overstock, or poor model fit. |
Next Issue
So we have decided to predict individual vodka on a daily basis to start but right off the bat, we have days with Zero sales, we have 60 vodkas in the store, i checked over the course 18 months, 01/01/2022- 06/30/2023 we sold 167 bottles of ABSOLUT SWEDISH VODKA 80PRF. So what do you think will happen for a daily projection for that one vodka?

Took me a minute, the WAPE is 2.93, that translates to 293% our range is 1-100, also known as poor model fit, i would call it terrible model fit.
That takes us to an easy decision, predict the amount of vodka we need for the month for each vodka. Thats an easier order anyway, wholesalers don’t want to show up every day to deliver 1 bottle of vodka. So we aggregate the data into a month predict for the next three months and run the analysis.

That puts our WAPE at 15.7% within the good range, with a human in the loop, this should be reliable! The MAE is 48 which for a 3 month horizon we missed by 16 bottles a month, not terrible, but not great either, maybe the store manager decides not to by anymore for the third month? Or maybe we get lucky and people stock up for halloween…